Ethiopian vs Immigrants from Germany Male Disability
COMPARE
Ethiopian
Immigrants from Germany
Male Disability
Male Disability Comparison
Ethiopians
Immigrants from Germany
10.2%
MALE DISABILITY
99.8/ 100
METRIC RATING
36th/ 347
METRIC RANK
12.3%
MALE DISABILITY
0.1/ 100
METRIC RATING
267th/ 347
METRIC RANK
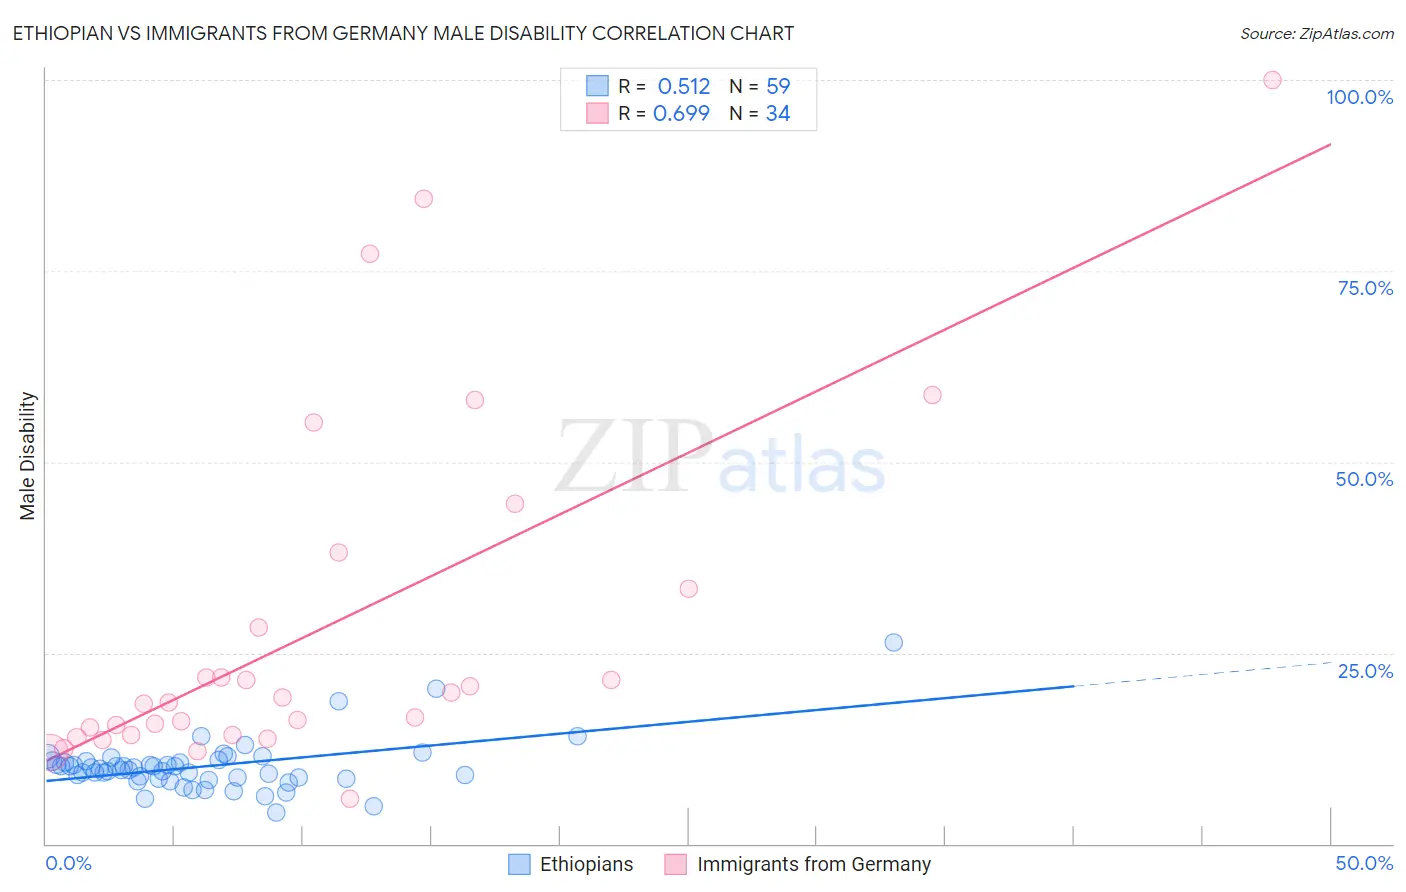
Ethiopian vs Immigrants from Germany Male Disability Correlation Chart
The statistical analysis conducted on geographies consisting of 223,232,754 people shows a substantial positive correlation between the proportion of Ethiopians and percentage of males with a disability in the United States with a correlation coefficient (R) of 0.512 and weighted average of 10.2%. Similarly, the statistical analysis conducted on geographies consisting of 463,850,065 people shows a significant positive correlation between the proportion of Immigrants from Germany and percentage of males with a disability in the United States with a correlation coefficient (R) of 0.699 and weighted average of 12.3%, a difference of 20.2%.
Male Disability Correlation Summary
| Measurement | Ethiopian | Immigrants from Germany |
| Minimum | 4.2% | 5.9% |
| Maximum | 26.3% | 100.0% |
| Range | 22.2% | 94.1% |
| Mean | 10.1% | 28.5% |
| Median | 9.8% | 18.8% |
| Interquartile 25% (IQ1) | 8.5% | 14.2% |
| Interquartile 75% (IQ3) | 10.8% | 33.3% |
| Interquartile Range (IQR) | 2.3% | 19.1% |
| Standard Deviation (Sample) | 3.4% | 23.0% |
| Standard Deviation (Population) | 3.4% | 22.7% |
Similar Demographics by Male Disability
Demographics Similar to Ethiopians by Male Disability
In terms of male disability, the demographic groups most similar to Ethiopians are Immigrants from Argentina (10.2%, a difference of 0.050%), Immigrants from Indonesia (10.2%, a difference of 0.070%), Immigrants from Turkey (10.2%, a difference of 0.16%), Immigrants from Ethiopia (10.2%, a difference of 0.22%), and Immigrants from Kuwait (10.2%, a difference of 0.24%).
| Demographics | Rating | Rank | Male Disability |
| Venezuelans | 99.9 /100 | #29 | Exceptional 10.1% |
| Immigrants | Egypt | 99.9 /100 | #30 | Exceptional 10.1% |
| Soviet Union | 99.9 /100 | #31 | Exceptional 10.1% |
| Argentineans | 99.9 /100 | #32 | Exceptional 10.1% |
| Immigrants | Ethiopia | 99.9 /100 | #33 | Exceptional 10.2% |
| Immigrants | Turkey | 99.9 /100 | #34 | Exceptional 10.2% |
| Immigrants | Argentina | 99.9 /100 | #35 | Exceptional 10.2% |
| Ethiopians | 99.8 /100 | #36 | Exceptional 10.2% |
| Immigrants | Indonesia | 99.8 /100 | #37 | Exceptional 10.2% |
| Immigrants | Kuwait | 99.8 /100 | #38 | Exceptional 10.2% |
| Afghans | 99.8 /100 | #39 | Exceptional 10.2% |
| Immigrants | Nepal | 99.8 /100 | #40 | Exceptional 10.3% |
| Taiwanese | 99.8 /100 | #41 | Exceptional 10.3% |
| Mongolians | 99.7 /100 | #42 | Exceptional 10.3% |
| Immigrants | Bangladesh | 99.7 /100 | #43 | Exceptional 10.3% |
Demographics Similar to Immigrants from Germany by Male Disability
In terms of male disability, the demographic groups most similar to Immigrants from Germany are Hawaiian (12.3%, a difference of 0.050%), Immigrants from Portugal (12.3%, a difference of 0.070%), Portuguese (12.3%, a difference of 0.13%), Czechoslovakian (12.3%, a difference of 0.13%), and Spaniard (12.3%, a difference of 0.21%).
| Demographics | Rating | Rank | Male Disability |
| Swedes | 0.3 /100 | #260 | Tragic 12.1% |
| Slavs | 0.2 /100 | #261 | Tragic 12.2% |
| Norwegians | 0.2 /100 | #262 | Tragic 12.2% |
| Canadians | 0.2 /100 | #263 | Tragic 12.2% |
| Nepalese | 0.2 /100 | #264 | Tragic 12.2% |
| Immigrants | Portugal | 0.1 /100 | #265 | Tragic 12.3% |
| Hawaiians | 0.1 /100 | #266 | Tragic 12.3% |
| Immigrants | Germany | 0.1 /100 | #267 | Tragic 12.3% |
| Portuguese | 0.1 /100 | #268 | Tragic 12.3% |
| Czechoslovakians | 0.1 /100 | #269 | Tragic 12.3% |
| Spaniards | 0.1 /100 | #270 | Tragic 12.3% |
| Scandinavians | 0.1 /100 | #271 | Tragic 12.3% |
| Hmong | 0.0 /100 | #272 | Tragic 12.5% |
| Native Hawaiians | 0.0 /100 | #273 | Tragic 12.5% |
| Hopi | 0.0 /100 | #274 | Tragic 12.5% |