Ethiopian vs Immigrants from Somalia Currently Married
COMPARE
Ethiopian
Immigrants from Somalia
Currently Married
Currently Married Comparison
Ethiopians
Immigrants from Somalia
44.5%
CURRENTLY MARRIED
0.7/ 100
METRIC RATING
241st/ 347
METRIC RANK
41.2%
CURRENTLY MARRIED
0.0/ 100
METRIC RATING
319th/ 347
METRIC RANK
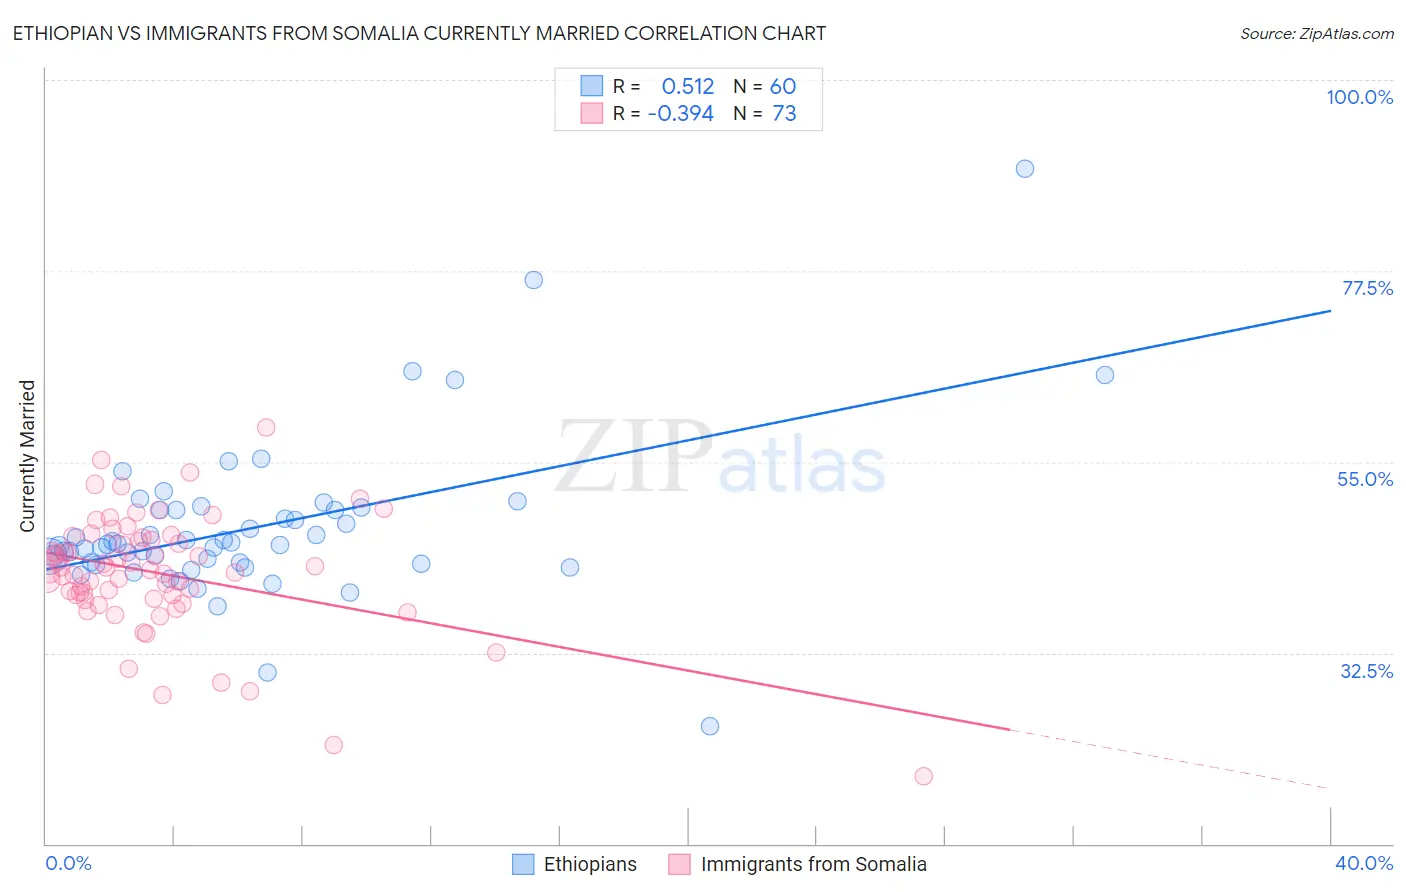
Ethiopian vs Immigrants from Somalia Currently Married Correlation Chart
The statistical analysis conducted on geographies consisting of 223,255,094 people shows a substantial positive correlation between the proportion of Ethiopians and percentage of population currently married in the United States with a correlation coefficient (R) of 0.512 and weighted average of 44.5%. Similarly, the statistical analysis conducted on geographies consisting of 92,108,089 people shows a mild negative correlation between the proportion of Immigrants from Somalia and percentage of population currently married in the United States with a correlation coefficient (R) of -0.394 and weighted average of 41.2%, a difference of 8.1%.
Currently Married Correlation Summary
| Measurement | Ethiopian | Immigrants from Somalia |
| Minimum | 23.8% | 18.0% |
| Maximum | 89.5% | 59.1% |
| Range | 65.7% | 41.1% |
| Mean | 47.3% | 41.9% |
| Median | 45.2% | 42.3% |
| Interquartile 25% (IQ1) | 43.0% | 39.1% |
| Interquartile 75% (IQ3) | 49.4% | 45.9% |
| Interquartile Range (IQR) | 6.3% | 6.8% |
| Standard Deviation (Sample) | 9.5% | 7.0% |
| Standard Deviation (Population) | 9.4% | 6.9% |
Similar Demographics by Currently Married
Demographics Similar to Ethiopians by Currently Married
In terms of currently married, the demographic groups most similar to Ethiopians are Immigrants from Cambodia (44.5%, a difference of 0.030%), Immigrants from Ethiopia (44.5%, a difference of 0.040%), Immigrants from Mexico (44.5%, a difference of 0.060%), Mexican American Indian (44.5%, a difference of 0.060%), and Japanese (44.5%, a difference of 0.12%).
| Demographics | Rating | Rank | Currently Married |
| Iroquois | 1.1 /100 | #234 | Tragic 44.7% |
| Alaskan Athabascans | 0.9 /100 | #235 | Tragic 44.6% |
| Cubans | 0.9 /100 | #236 | Tragic 44.6% |
| Seminole | 0.9 /100 | #237 | Tragic 44.6% |
| Moroccans | 0.9 /100 | #238 | Tragic 44.6% |
| Immigrants | Mexico | 0.7 /100 | #239 | Tragic 44.5% |
| Mexican American Indians | 0.7 /100 | #240 | Tragic 44.5% |
| Ethiopians | 0.7 /100 | #241 | Tragic 44.5% |
| Immigrants | Cambodia | 0.7 /100 | #242 | Tragic 44.5% |
| Immigrants | Ethiopia | 0.7 /100 | #243 | Tragic 44.5% |
| Japanese | 0.6 /100 | #244 | Tragic 44.5% |
| Immigrants | Armenia | 0.4 /100 | #245 | Tragic 44.3% |
| Immigrants | Burma/Myanmar | 0.4 /100 | #246 | Tragic 44.3% |
| Ugandans | 0.4 /100 | #247 | Tragic 44.2% |
| Nicaraguans | 0.3 /100 | #248 | Tragic 44.2% |
Demographics Similar to Immigrants from Somalia by Currently Married
In terms of currently married, the demographic groups most similar to Immigrants from Somalia are Bahamian (41.2%, a difference of 0.020%), Immigrants from Jamaica (41.1%, a difference of 0.060%), Haitian (41.3%, a difference of 0.20%), Immigrants from Caribbean (41.3%, a difference of 0.22%), and Inupiat (41.3%, a difference of 0.28%).
| Demographics | Rating | Rank | Currently Married |
| Somalis | 0.0 /100 | #312 | Tragic 41.5% |
| Jamaicans | 0.0 /100 | #313 | Tragic 41.4% |
| West Indians | 0.0 /100 | #314 | Tragic 41.3% |
| Inupiat | 0.0 /100 | #315 | Tragic 41.3% |
| Immigrants | Caribbean | 0.0 /100 | #316 | Tragic 41.3% |
| Haitians | 0.0 /100 | #317 | Tragic 41.3% |
| Bahamians | 0.0 /100 | #318 | Tragic 41.2% |
| Immigrants | Somalia | 0.0 /100 | #319 | Tragic 41.2% |
| Immigrants | Jamaica | 0.0 /100 | #320 | Tragic 41.1% |
| Immigrants | Congo | 0.0 /100 | #321 | Tragic 41.1% |
| Immigrants | Haiti | 0.0 /100 | #322 | Tragic 41.0% |
| Immigrants | West Indies | 0.0 /100 | #323 | Tragic 40.7% |
| Immigrants | Senegal | 0.0 /100 | #324 | Tragic 40.7% |
| U.S. Virgin Islanders | 0.0 /100 | #325 | Tragic 40.7% |
| Barbadians | 0.0 /100 | #326 | Tragic 40.6% |