Ethiopian vs Black/African American Currently Married
COMPARE
Ethiopian
Black/African American
Currently Married
Currently Married Comparison
Ethiopians
Blacks/African Americans
44.5%
CURRENTLY MARRIED
0.7/ 100
METRIC RATING
241st/ 347
METRIC RANK
39.6%
CURRENTLY MARRIED
0.0/ 100
METRIC RATING
337th/ 347
METRIC RANK
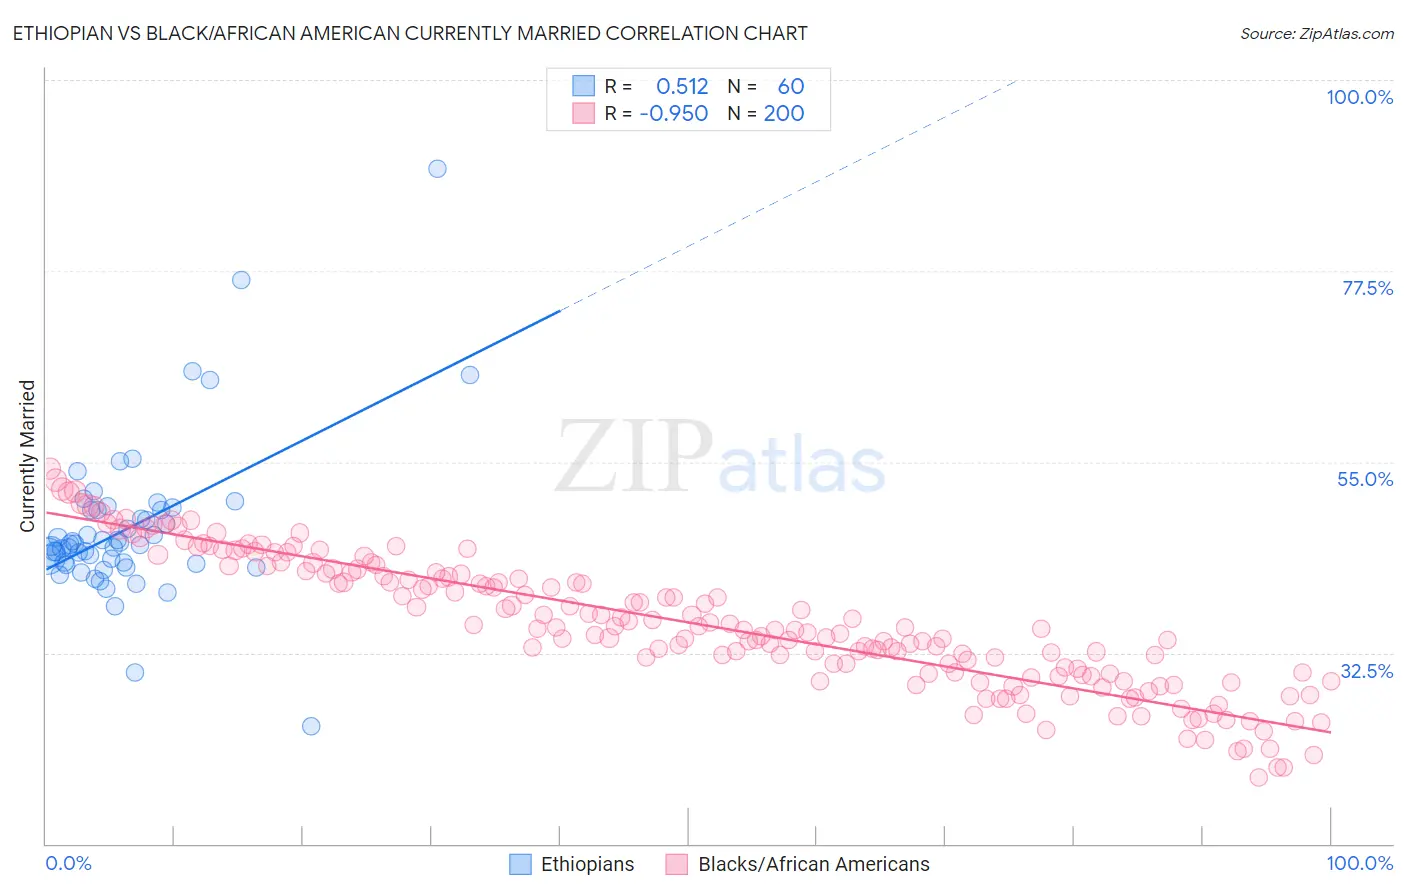
Ethiopian vs Black/African American Currently Married Correlation Chart
The statistical analysis conducted on geographies consisting of 223,255,094 people shows a substantial positive correlation between the proportion of Ethiopians and percentage of population currently married in the United States with a correlation coefficient (R) of 0.512 and weighted average of 44.5%. Similarly, the statistical analysis conducted on geographies consisting of 565,898,128 people shows a near-perfect negative correlation between the proportion of Blacks/African Americans and percentage of population currently married in the United States with a correlation coefficient (R) of -0.950 and weighted average of 39.6%, a difference of 12.4%.
Currently Married Correlation Summary
| Measurement | Ethiopian | Black/African American |
| Minimum | 23.8% | 17.8% |
| Maximum | 89.5% | 54.2% |
| Range | 65.7% | 36.4% |
| Mean | 47.3% | 36.1% |
| Median | 45.2% | 35.4% |
| Interquartile 25% (IQ1) | 43.0% | 30.1% |
| Interquartile 75% (IQ3) | 49.4% | 42.1% |
| Interquartile Range (IQR) | 6.3% | 12.0% |
| Standard Deviation (Sample) | 9.5% | 7.9% |
| Standard Deviation (Population) | 9.4% | 7.9% |
Similar Demographics by Currently Married
Demographics Similar to Ethiopians by Currently Married
In terms of currently married, the demographic groups most similar to Ethiopians are Immigrants from Cambodia (44.5%, a difference of 0.030%), Immigrants from Ethiopia (44.5%, a difference of 0.040%), Immigrants from Mexico (44.5%, a difference of 0.060%), Mexican American Indian (44.5%, a difference of 0.060%), and Japanese (44.5%, a difference of 0.12%).
| Demographics | Rating | Rank | Currently Married |
| Iroquois | 1.1 /100 | #234 | Tragic 44.7% |
| Alaskan Athabascans | 0.9 /100 | #235 | Tragic 44.6% |
| Cubans | 0.9 /100 | #236 | Tragic 44.6% |
| Seminole | 0.9 /100 | #237 | Tragic 44.6% |
| Moroccans | 0.9 /100 | #238 | Tragic 44.6% |
| Immigrants | Mexico | 0.7 /100 | #239 | Tragic 44.5% |
| Mexican American Indians | 0.7 /100 | #240 | Tragic 44.5% |
| Ethiopians | 0.7 /100 | #241 | Tragic 44.5% |
| Immigrants | Cambodia | 0.7 /100 | #242 | Tragic 44.5% |
| Immigrants | Ethiopia | 0.7 /100 | #243 | Tragic 44.5% |
| Japanese | 0.6 /100 | #244 | Tragic 44.5% |
| Immigrants | Armenia | 0.4 /100 | #245 | Tragic 44.3% |
| Immigrants | Burma/Myanmar | 0.4 /100 | #246 | Tragic 44.3% |
| Ugandans | 0.4 /100 | #247 | Tragic 44.2% |
| Nicaraguans | 0.3 /100 | #248 | Tragic 44.2% |
Demographics Similar to Blacks/African Americans by Currently Married
In terms of currently married, the demographic groups most similar to Blacks/African Americans are Cape Verdean (39.6%, a difference of 0.090%), Dominican (39.5%, a difference of 0.25%), British West Indian (39.8%, a difference of 0.38%), Lumbee (39.8%, a difference of 0.56%), and Puerto Rican (39.9%, a difference of 0.72%).
| Demographics | Rating | Rank | Currently Married |
| Immigrants | Dominica | 0.0 /100 | #330 | Tragic 40.3% |
| Immigrants | Barbados | 0.0 /100 | #331 | Tragic 40.3% |
| Immigrants | St. Vincent and the Grenadines | 0.0 /100 | #332 | Tragic 40.1% |
| Yup'ik | 0.0 /100 | #333 | Tragic 39.9% |
| Puerto Ricans | 0.0 /100 | #334 | Tragic 39.9% |
| Lumbee | 0.0 /100 | #335 | Tragic 39.8% |
| British West Indians | 0.0 /100 | #336 | Tragic 39.8% |
| Blacks/African Americans | 0.0 /100 | #337 | Tragic 39.6% |
| Cape Verdeans | 0.0 /100 | #338 | Tragic 39.6% |
| Dominicans | 0.0 /100 | #339 | Tragic 39.5% |
| Immigrants | Grenada | 0.0 /100 | #340 | Tragic 39.1% |
| Navajo | 0.0 /100 | #341 | Tragic 39.0% |
| Immigrants | Dominican Republic | 0.0 /100 | #342 | Tragic 38.9% |
| Pueblo | 0.0 /100 | #343 | Tragic 38.2% |
| Immigrants | Cabo Verde | 0.0 /100 | #344 | Tragic 37.8% |