Delaware vs Slovak Average Family Size
COMPARE
Delaware
Slovak
Average Family Size
Average Family Size Comparison
Delaware
Slovaks
3.20
AVERAGE FAMILY SIZE
11.1/ 100
METRIC RATING
215th/ 347
METRIC RANK
3.06
AVERAGE FAMILY SIZE
0.0/ 100
METRIC RATING
346th/ 347
METRIC RANK
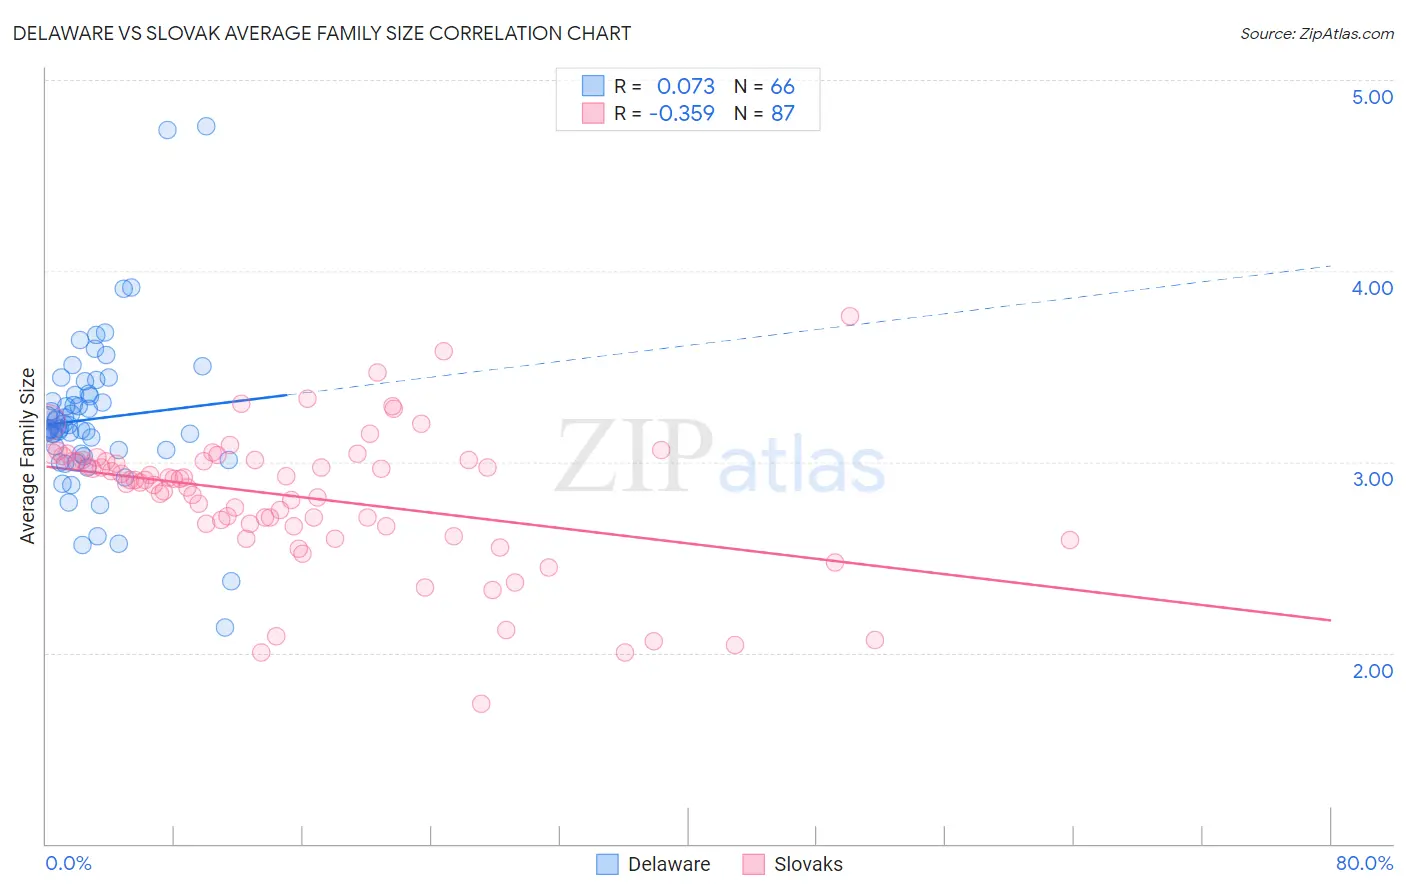
Delaware vs Slovak Average Family Size Correlation Chart
The statistical analysis conducted on geographies consisting of 96,226,564 people shows a slight positive correlation between the proportion of Delaware and average family size in the United States with a correlation coefficient (R) of 0.073 and weighted average of 3.20. Similarly, the statistical analysis conducted on geographies consisting of 397,683,086 people shows a mild negative correlation between the proportion of Slovaks and average family size in the United States with a correlation coefficient (R) of -0.359 and weighted average of 3.06, a difference of 4.4%.
Average Family Size Correlation Summary
| Measurement | Delaware | Slovak |
| Minimum | 2.13 | 1.73 |
| Maximum | 4.76 | 3.76 |
| Range | 2.63 | 2.03 |
| Mean | 3.22 | 2.82 |
| Median | 3.18 | 2.91 |
| Interquartile 25% (IQ1) | 3.04 | 2.67 |
| Interquartile 75% (IQ3) | 3.35 | 3.01 |
| Interquartile Range (IQR) | 0.31 | 0.35 |
| Standard Deviation (Sample) | 0.41 | 0.36 |
| Standard Deviation (Population) | 0.41 | 0.36 |
Similar Demographics by Average Family Size
Demographics Similar to Delaware by Average Family Size
In terms of average family size, the demographic groups most similar to Delaware are Bermudan (3.20, a difference of 0.0%), Somali (3.20, a difference of 0.010%), Mongolian (3.20, a difference of 0.020%), Immigrants from Somalia (3.20, a difference of 0.040%), and Immigrants from Iran (3.20, a difference of 0.050%).
| Demographics | Rating | Rank | Average Family Size |
| Chippewa | 13.3 /100 | #208 | Poor 3.20 |
| Sudanese | 13.3 /100 | #209 | Poor 3.20 |
| Zimbabweans | 12.6 /100 | #210 | Poor 3.20 |
| Immigrants | Iran | 12.1 /100 | #211 | Poor 3.20 |
| Creek | 12.1 /100 | #212 | Poor 3.20 |
| Mongolians | 11.5 /100 | #213 | Poor 3.20 |
| Somalis | 11.2 /100 | #214 | Poor 3.20 |
| Delaware | 11.1 /100 | #215 | Poor 3.20 |
| Bermudans | 11.0 /100 | #216 | Poor 3.20 |
| Immigrants | Somalia | 10.3 /100 | #217 | Poor 3.20 |
| French American Indians | 9.8 /100 | #218 | Tragic 3.20 |
| Pennsylvania Germans | 9.3 /100 | #219 | Tragic 3.19 |
| Lebanese | 9.1 /100 | #220 | Tragic 3.19 |
| Immigrants | Ukraine | 7.2 /100 | #221 | Tragic 3.19 |
| Immigrants | Kuwait | 7.2 /100 | #222 | Tragic 3.19 |
Demographics Similar to Slovaks by Average Family Size
In terms of average family size, the demographic groups most similar to Slovaks are Carpatho Rusyn (3.06, a difference of 0.060%), Slovene (3.07, a difference of 0.29%), French Canadian (3.07, a difference of 0.33%), Norwegian (3.08, a difference of 0.57%), and German (3.09, a difference of 0.80%).
| Demographics | Rating | Rank | Average Family Size |
| Estonians | 0.0 /100 | #333 | Tragic 3.10 |
| Lithuanians | 0.0 /100 | #334 | Tragic 3.10 |
| Luxembourgers | 0.0 /100 | #335 | Tragic 3.10 |
| Irish | 0.0 /100 | #336 | Tragic 3.10 |
| Swedes | 0.0 /100 | #337 | Tragic 3.10 |
| French | 0.0 /100 | #338 | Tragic 3.10 |
| Croatians | 0.0 /100 | #339 | Tragic 3.10 |
| Finns | 0.0 /100 | #340 | Tragic 3.09 |
| Poles | 0.0 /100 | #341 | Tragic 3.09 |
| Germans | 0.0 /100 | #342 | Tragic 3.09 |
| Norwegians | 0.0 /100 | #343 | Tragic 3.08 |
| French Canadians | 0.0 /100 | #344 | Tragic 3.07 |
| Slovenes | 0.0 /100 | #345 | Tragic 3.07 |
| Slovaks | 0.0 /100 | #346 | Tragic 3.06 |
| Carpatho Rusyns | 0.0 /100 | #347 | Tragic 3.06 |