Jordanian vs Slovak Average Family Size
COMPARE
Jordanian
Slovak
Average Family Size
Average Family Size Comparison
Jordanians
Slovaks
3.24
AVERAGE FAMILY SIZE
73.5/ 100
METRIC RATING
151st/ 347
METRIC RANK
3.06
AVERAGE FAMILY SIZE
0.0/ 100
METRIC RATING
346th/ 347
METRIC RANK
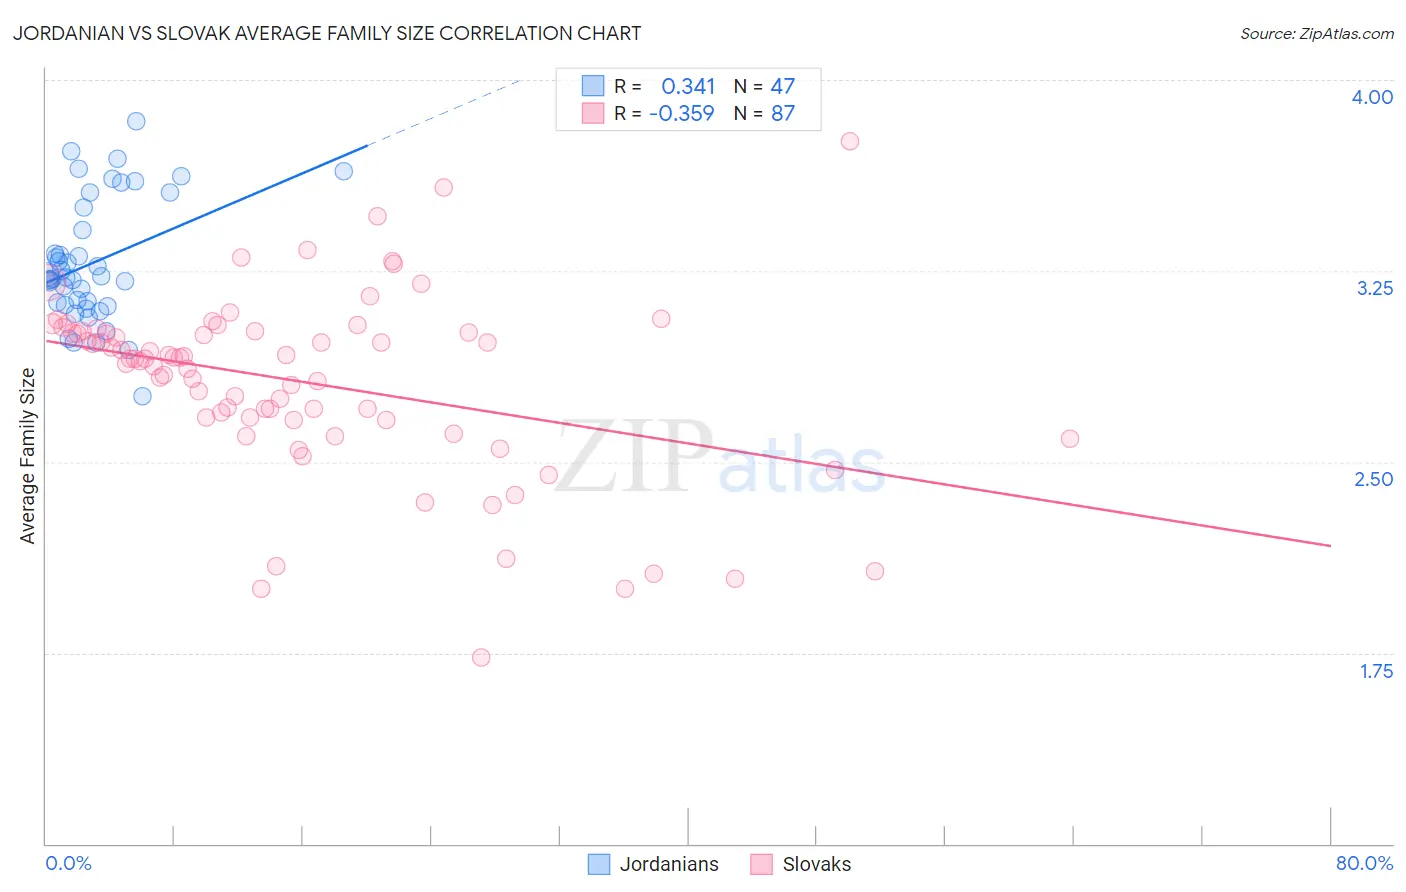
Jordanian vs Slovak Average Family Size Correlation Chart
The statistical analysis conducted on geographies consisting of 166,395,405 people shows a mild positive correlation between the proportion of Jordanians and average family size in the United States with a correlation coefficient (R) of 0.341 and weighted average of 3.24. Similarly, the statistical analysis conducted on geographies consisting of 397,683,086 people shows a mild negative correlation between the proportion of Slovaks and average family size in the United States with a correlation coefficient (R) of -0.359 and weighted average of 3.06, a difference of 5.9%.
Average Family Size Correlation Summary
| Measurement | Jordanian | Slovak |
| Minimum | 2.76 | 1.73 |
| Maximum | 3.84 | 3.76 |
| Range | 1.08 | 2.03 |
| Mean | 3.28 | 2.82 |
| Median | 3.22 | 2.91 |
| Interquartile 25% (IQ1) | 3.12 | 2.67 |
| Interquartile 75% (IQ3) | 3.50 | 3.01 |
| Interquartile Range (IQR) | 0.38 | 0.35 |
| Standard Deviation (Sample) | 0.24 | 0.36 |
| Standard Deviation (Population) | 0.24 | 0.36 |
Similar Demographics by Average Family Size
Demographics Similar to Jordanians by Average Family Size
In terms of average family size, the demographic groups most similar to Jordanians are Indian (Asian) (3.24, a difference of 0.0%), Assyrian/Chaldean/Syriac (3.24, a difference of 0.010%), Spanish American (3.24, a difference of 0.020%), Blackfeet (3.24, a difference of 0.040%), and Immigrants from Jordan (3.24, a difference of 0.050%).
| Demographics | Rating | Rank | Average Family Size |
| Tsimshian | 80.2 /100 | #144 | Excellent 3.25 |
| Armenians | 78.2 /100 | #145 | Good 3.25 |
| Immigrants | Africa | 77.9 /100 | #146 | Good 3.25 |
| Immigrants | Jordan | 75.7 /100 | #147 | Good 3.24 |
| Blackfeet | 75.0 /100 | #148 | Good 3.24 |
| Assyrians/Chaldeans/Syriacs | 73.8 /100 | #149 | Good 3.24 |
| Indians (Asian) | 73.6 /100 | #150 | Good 3.24 |
| Jordanians | 73.5 /100 | #151 | Good 3.24 |
| Spanish Americans | 72.5 /100 | #152 | Good 3.24 |
| Immigrants | Eritrea | 71.4 /100 | #153 | Good 3.24 |
| Immigrants | Egypt | 70.0 /100 | #154 | Good 3.24 |
| Seminole | 68.2 /100 | #155 | Good 3.24 |
| Immigrants | Taiwan | 68.1 /100 | #156 | Good 3.24 |
| Immigrants | Uzbekistan | 67.0 /100 | #157 | Good 3.24 |
| Iraqis | 64.3 /100 | #158 | Good 3.24 |
Demographics Similar to Slovaks by Average Family Size
In terms of average family size, the demographic groups most similar to Slovaks are Carpatho Rusyn (3.06, a difference of 0.060%), Slovene (3.07, a difference of 0.29%), French Canadian (3.07, a difference of 0.33%), Norwegian (3.08, a difference of 0.57%), and German (3.09, a difference of 0.80%).
| Demographics | Rating | Rank | Average Family Size |
| Estonians | 0.0 /100 | #333 | Tragic 3.10 |
| Lithuanians | 0.0 /100 | #334 | Tragic 3.10 |
| Luxembourgers | 0.0 /100 | #335 | Tragic 3.10 |
| Irish | 0.0 /100 | #336 | Tragic 3.10 |
| Swedes | 0.0 /100 | #337 | Tragic 3.10 |
| French | 0.0 /100 | #338 | Tragic 3.10 |
| Croatians | 0.0 /100 | #339 | Tragic 3.10 |
| Finns | 0.0 /100 | #340 | Tragic 3.09 |
| Poles | 0.0 /100 | #341 | Tragic 3.09 |
| Germans | 0.0 /100 | #342 | Tragic 3.09 |
| Norwegians | 0.0 /100 | #343 | Tragic 3.08 |
| French Canadians | 0.0 /100 | #344 | Tragic 3.07 |
| Slovenes | 0.0 /100 | #345 | Tragic 3.07 |
| Slovaks | 0.0 /100 | #346 | Tragic 3.06 |
| Carpatho Rusyns | 0.0 /100 | #347 | Tragic 3.06 |