Delaware vs Yakama Average Family Size
COMPARE
Delaware
Yakama
Average Family Size
Average Family Size Comparison
Delaware
Yakama
3.20
AVERAGE FAMILY SIZE
11.1/ 100
METRIC RATING
215th/ 347
METRIC RANK
3.45
AVERAGE FAMILY SIZE
100.0/ 100
METRIC RATING
25th/ 347
METRIC RANK
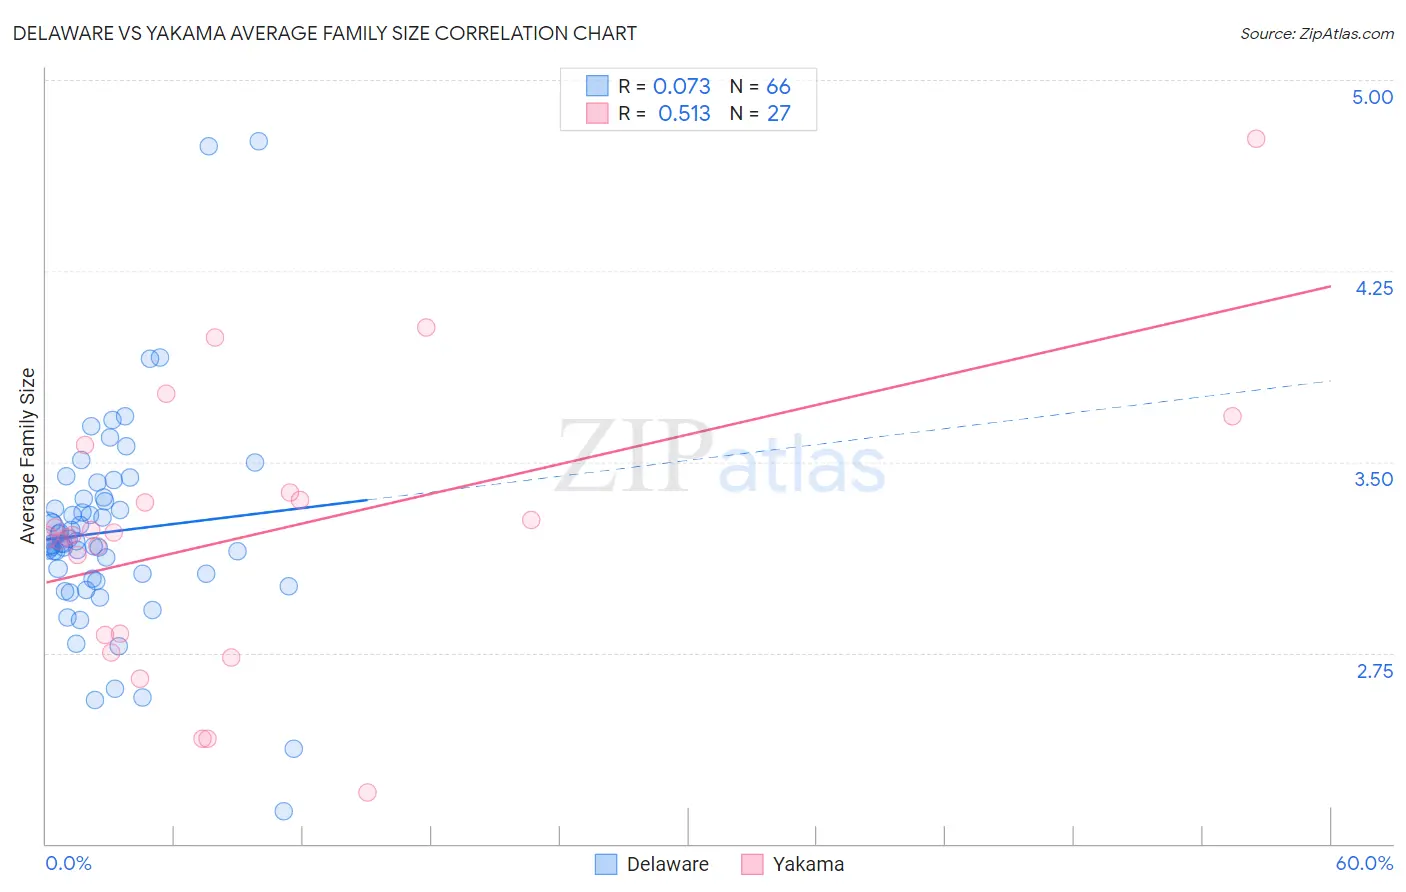
Delaware vs Yakama Average Family Size Correlation Chart
The statistical analysis conducted on geographies consisting of 96,226,564 people shows a slight positive correlation between the proportion of Delaware and average family size in the United States with a correlation coefficient (R) of 0.073 and weighted average of 3.20. Similarly, the statistical analysis conducted on geographies consisting of 19,917,879 people shows a substantial positive correlation between the proportion of Yakama and average family size in the United States with a correlation coefficient (R) of 0.513 and weighted average of 3.45, a difference of 7.7%.
Average Family Size Correlation Summary
| Measurement | Delaware | Yakama |
| Minimum | 2.13 | 2.20 |
| Maximum | 4.76 | 4.77 |
| Range | 2.63 | 2.57 |
| Mean | 3.22 | 3.21 |
| Median | 3.18 | 3.21 |
| Interquartile 25% (IQ1) | 3.04 | 2.82 |
| Interquartile 75% (IQ3) | 3.35 | 3.38 |
| Interquartile Range (IQR) | 0.31 | 0.56 |
| Standard Deviation (Sample) | 0.41 | 0.55 |
| Standard Deviation (Population) | 0.41 | 0.54 |
Similar Demographics by Average Family Size
Demographics Similar to Delaware by Average Family Size
In terms of average family size, the demographic groups most similar to Delaware are Bermudan (3.20, a difference of 0.0%), Somali (3.20, a difference of 0.010%), Mongolian (3.20, a difference of 0.020%), Immigrants from Somalia (3.20, a difference of 0.040%), and Immigrants from Iran (3.20, a difference of 0.050%).
| Demographics | Rating | Rank | Average Family Size |
| Chippewa | 13.3 /100 | #208 | Poor 3.20 |
| Sudanese | 13.3 /100 | #209 | Poor 3.20 |
| Zimbabweans | 12.6 /100 | #210 | Poor 3.20 |
| Immigrants | Iran | 12.1 /100 | #211 | Poor 3.20 |
| Creek | 12.1 /100 | #212 | Poor 3.20 |
| Mongolians | 11.5 /100 | #213 | Poor 3.20 |
| Somalis | 11.2 /100 | #214 | Poor 3.20 |
| Delaware | 11.1 /100 | #215 | Poor 3.20 |
| Bermudans | 11.0 /100 | #216 | Poor 3.20 |
| Immigrants | Somalia | 10.3 /100 | #217 | Poor 3.20 |
| French American Indians | 9.8 /100 | #218 | Tragic 3.20 |
| Pennsylvania Germans | 9.3 /100 | #219 | Tragic 3.19 |
| Lebanese | 9.1 /100 | #220 | Tragic 3.19 |
| Immigrants | Ukraine | 7.2 /100 | #221 | Tragic 3.19 |
| Immigrants | Kuwait | 7.2 /100 | #222 | Tragic 3.19 |
Demographics Similar to Yakama by Average Family Size
In terms of average family size, the demographic groups most similar to Yakama are Native/Alaskan (3.45, a difference of 0.11%), Immigrants from Fiji (3.45, a difference of 0.23%), Native Hawaiian (3.43, a difference of 0.51%), Apache (3.46, a difference of 0.52%), and Mexican American Indian (3.43, a difference of 0.52%).
| Demographics | Rating | Rank | Average Family Size |
| Salvadorans | 100.0 /100 | #18 | Exceptional 3.48 |
| Mexicans | 100.0 /100 | #19 | Exceptional 3.48 |
| Cheyenne | 100.0 /100 | #20 | Exceptional 3.47 |
| Yuman | 100.0 /100 | #21 | Exceptional 3.47 |
| Apache | 100.0 /100 | #22 | Exceptional 3.46 |
| Immigrants | Fiji | 100.0 /100 | #23 | Exceptional 3.45 |
| Natives/Alaskans | 100.0 /100 | #24 | Exceptional 3.45 |
| Yakama | 100.0 /100 | #25 | Exceptional 3.45 |
| Native Hawaiians | 100.0 /100 | #26 | Exceptional 3.43 |
| Mexican American Indians | 100.0 /100 | #27 | Exceptional 3.43 |
| Immigrants | Latin America | 100.0 /100 | #28 | Exceptional 3.42 |
| Nepalese | 100.0 /100 | #29 | Exceptional 3.42 |
| Samoans | 100.0 /100 | #30 | Exceptional 3.42 |
| Central Americans | 100.0 /100 | #31 | Exceptional 3.41 |
| Immigrants | Guatemala | 100.0 /100 | #32 | Exceptional 3.41 |