Austrian vs Slovak Average Family Size
COMPARE
Austrian
Slovak
Average Family Size
Average Family Size Comparison
Austrians
Slovaks
3.14
AVERAGE FAMILY SIZE
0.2/ 100
METRIC RATING
295th/ 347
METRIC RANK
3.06
AVERAGE FAMILY SIZE
0.0/ 100
METRIC RATING
346th/ 347
METRIC RANK
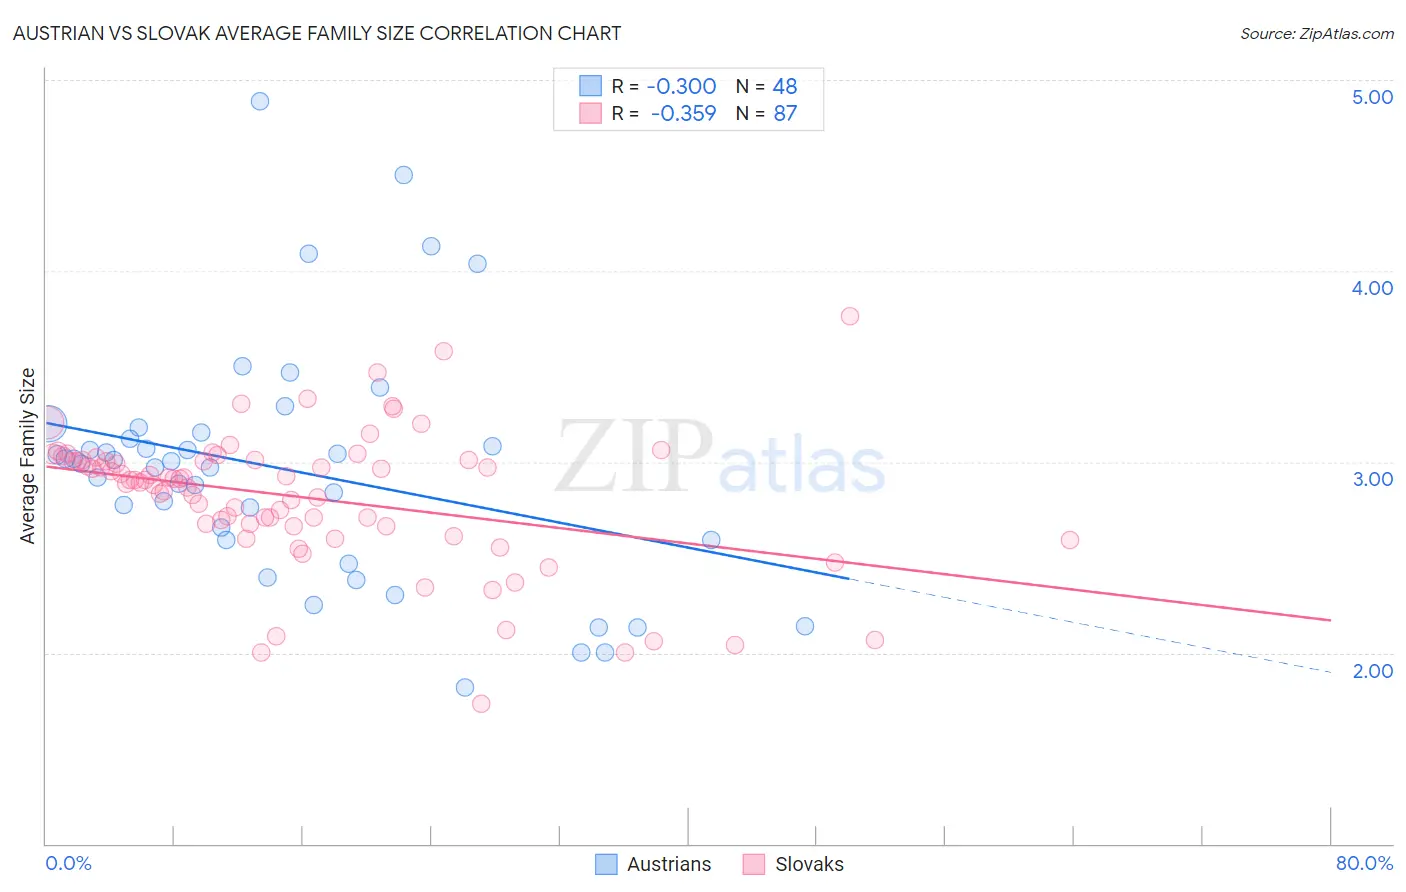
Austrian vs Slovak Average Family Size Correlation Chart
The statistical analysis conducted on geographies consisting of 451,810,696 people shows a mild negative correlation between the proportion of Austrians and average family size in the United States with a correlation coefficient (R) of -0.300 and weighted average of 3.14. Similarly, the statistical analysis conducted on geographies consisting of 397,683,086 people shows a mild negative correlation between the proportion of Slovaks and average family size in the United States with a correlation coefficient (R) of -0.359 and weighted average of 3.06, a difference of 2.4%.
Average Family Size Correlation Summary
| Measurement | Austrian | Slovak |
| Minimum | 1.82 | 1.73 |
| Maximum | 4.89 | 3.76 |
| Range | 3.07 | 2.03 |
| Mean | 2.96 | 2.82 |
| Median | 3.00 | 2.91 |
| Interquartile 25% (IQ1) | 2.59 | 2.67 |
| Interquartile 75% (IQ3) | 3.14 | 3.01 |
| Interquartile Range (IQR) | 0.55 | 0.35 |
| Standard Deviation (Sample) | 0.63 | 0.36 |
| Standard Deviation (Population) | 0.62 | 0.36 |
Similar Demographics by Average Family Size
Demographics Similar to Austrians by Average Family Size
In terms of average family size, the demographic groups most similar to Austrians are Ukrainian (3.14, a difference of 0.0%), Immigrants from Western Europe (3.14, a difference of 0.0%), Immigrants from Croatia (3.14, a difference of 0.010%), Colville (3.14, a difference of 0.010%), and European (3.14, a difference of 0.030%).
| Demographics | Rating | Rank | Average Family Size |
| Immigrants | Czechoslovakia | 0.3 /100 | #288 | Tragic 3.14 |
| Immigrants | Norway | 0.3 /100 | #289 | Tragic 3.14 |
| Cypriots | 0.3 /100 | #290 | Tragic 3.14 |
| Alsatians | 0.2 /100 | #291 | Tragic 3.14 |
| Europeans | 0.2 /100 | #292 | Tragic 3.14 |
| Scandinavians | 0.2 /100 | #293 | Tragic 3.14 |
| Immigrants | Croatia | 0.2 /100 | #294 | Tragic 3.14 |
| Austrians | 0.2 /100 | #295 | Tragic 3.14 |
| Ukrainians | 0.2 /100 | #296 | Tragic 3.14 |
| Immigrants | Western Europe | 0.2 /100 | #297 | Tragic 3.14 |
| Colville | 0.2 /100 | #298 | Tragic 3.14 |
| Canadians | 0.2 /100 | #299 | Tragic 3.14 |
| Immigrants | Sweden | 0.2 /100 | #300 | Tragic 3.14 |
| Macedonians | 0.2 /100 | #301 | Tragic 3.13 |
| Immigrants | Latvia | 0.2 /100 | #302 | Tragic 3.13 |
Demographics Similar to Slovaks by Average Family Size
In terms of average family size, the demographic groups most similar to Slovaks are Carpatho Rusyn (3.06, a difference of 0.060%), Slovene (3.07, a difference of 0.29%), French Canadian (3.07, a difference of 0.33%), Norwegian (3.08, a difference of 0.57%), and German (3.09, a difference of 0.80%).
| Demographics | Rating | Rank | Average Family Size |
| Estonians | 0.0 /100 | #333 | Tragic 3.10 |
| Lithuanians | 0.0 /100 | #334 | Tragic 3.10 |
| Luxembourgers | 0.0 /100 | #335 | Tragic 3.10 |
| Irish | 0.0 /100 | #336 | Tragic 3.10 |
| Swedes | 0.0 /100 | #337 | Tragic 3.10 |
| French | 0.0 /100 | #338 | Tragic 3.10 |
| Croatians | 0.0 /100 | #339 | Tragic 3.10 |
| Finns | 0.0 /100 | #340 | Tragic 3.09 |
| Poles | 0.0 /100 | #341 | Tragic 3.09 |
| Germans | 0.0 /100 | #342 | Tragic 3.09 |
| Norwegians | 0.0 /100 | #343 | Tragic 3.08 |
| French Canadians | 0.0 /100 | #344 | Tragic 3.07 |
| Slovenes | 0.0 /100 | #345 | Tragic 3.07 |
| Slovaks | 0.0 /100 | #346 | Tragic 3.06 |
| Carpatho Rusyns | 0.0 /100 | #347 | Tragic 3.06 |