Costa Rican vs Slovak Average Family Size
COMPARE
Costa Rican
Slovak
Average Family Size
Average Family Size Comparison
Costa Ricans
Slovaks
3.26
AVERAGE FAMILY SIZE
86.8/ 100
METRIC RATING
132nd/ 347
METRIC RANK
3.06
AVERAGE FAMILY SIZE
0.0/ 100
METRIC RATING
346th/ 347
METRIC RANK
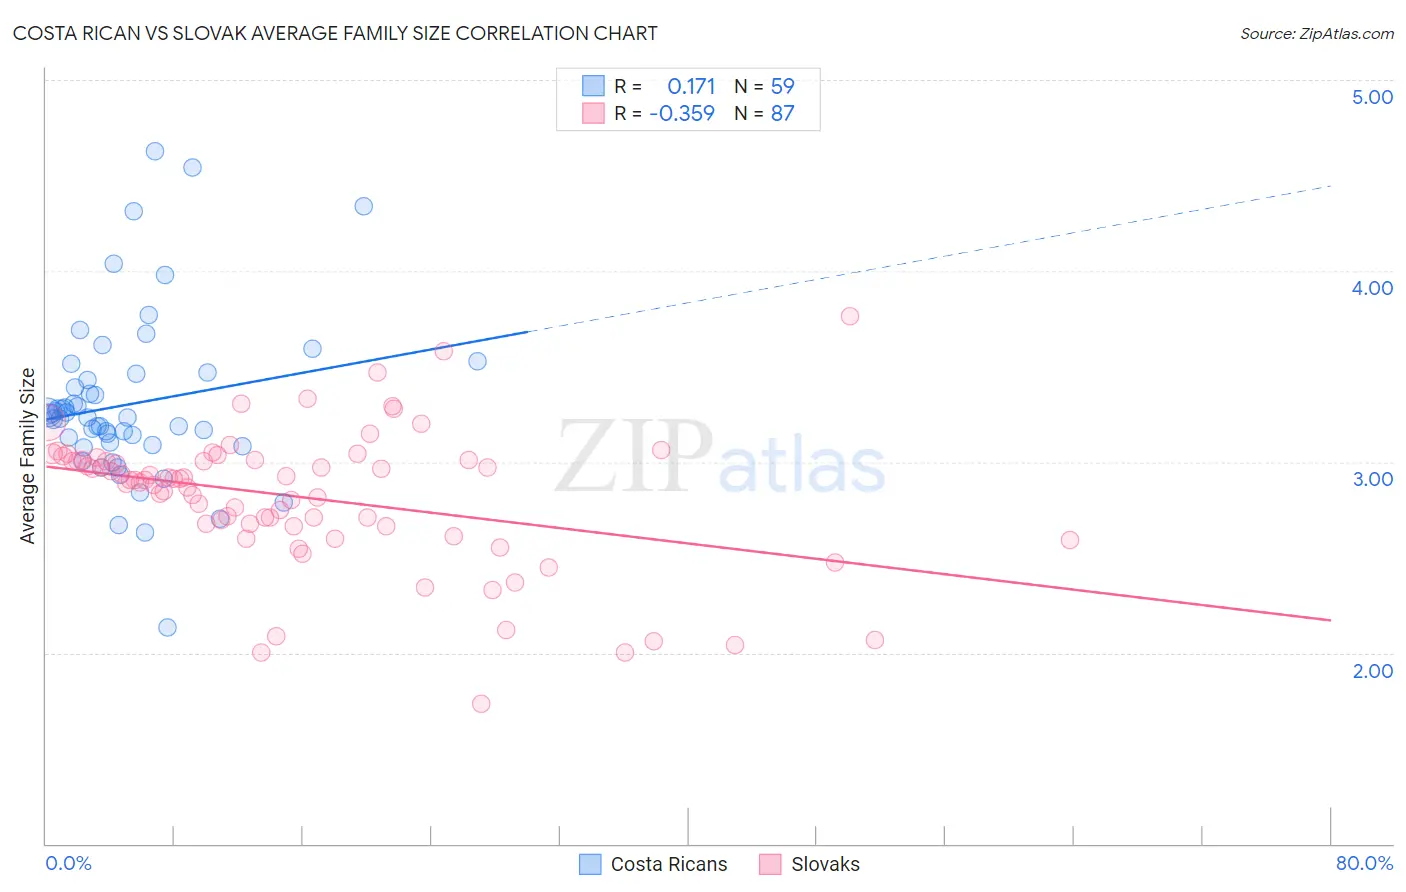
Costa Rican vs Slovak Average Family Size Correlation Chart
The statistical analysis conducted on geographies consisting of 253,470,463 people shows a poor positive correlation between the proportion of Costa Ricans and average family size in the United States with a correlation coefficient (R) of 0.171 and weighted average of 3.26. Similarly, the statistical analysis conducted on geographies consisting of 397,683,086 people shows a mild negative correlation between the proportion of Slovaks and average family size in the United States with a correlation coefficient (R) of -0.359 and weighted average of 3.06, a difference of 6.3%.
Average Family Size Correlation Summary
| Measurement | Costa Rican | Slovak |
| Minimum | 2.13 | 1.73 |
| Maximum | 4.63 | 3.76 |
| Range | 2.50 | 2.03 |
| Mean | 3.30 | 2.82 |
| Median | 3.23 | 2.91 |
| Interquartile 25% (IQ1) | 3.09 | 2.67 |
| Interquartile 75% (IQ3) | 3.46 | 3.01 |
| Interquartile Range (IQR) | 0.37 | 0.35 |
| Standard Deviation (Sample) | 0.44 | 0.36 |
| Standard Deviation (Population) | 0.44 | 0.36 |
Similar Demographics by Average Family Size
Demographics Similar to Costa Ricans by Average Family Size
In terms of average family size, the demographic groups most similar to Costa Ricans are Immigrants from Venezuela (3.26, a difference of 0.020%), Immigrants from Western Asia (3.26, a difference of 0.040%), Laotian (3.26, a difference of 0.070%), African (3.25, a difference of 0.070%), and Immigrants from Hong Kong (3.26, a difference of 0.080%).
| Demographics | Rating | Rank | Average Family Size |
| Immigrants | Cuba | 91.3 /100 | #125 | Exceptional 3.26 |
| Immigrants | Costa Rica | 90.7 /100 | #126 | Exceptional 3.26 |
| Immigrants | Syria | 90.6 /100 | #127 | Exceptional 3.26 |
| Colombians | 89.9 /100 | #128 | Excellent 3.26 |
| Immigrants | Hong Kong | 88.6 /100 | #129 | Excellent 3.26 |
| Laotians | 88.5 /100 | #130 | Excellent 3.26 |
| Immigrants | Western Asia | 87.7 /100 | #131 | Excellent 3.26 |
| Costa Ricans | 86.8 /100 | #132 | Excellent 3.26 |
| Immigrants | Venezuela | 86.3 /100 | #133 | Excellent 3.26 |
| Africans | 84.9 /100 | #134 | Excellent 3.25 |
| Panamanians | 84.2 /100 | #135 | Excellent 3.25 |
| Comanche | 82.8 /100 | #136 | Excellent 3.25 |
| Immigrants | Middle Africa | 82.4 /100 | #137 | Excellent 3.25 |
| Cubans | 81.8 /100 | #138 | Excellent 3.25 |
| Immigrants | Ethiopia | 81.6 /100 | #139 | Excellent 3.25 |
Demographics Similar to Slovaks by Average Family Size
In terms of average family size, the demographic groups most similar to Slovaks are Carpatho Rusyn (3.06, a difference of 0.060%), Slovene (3.07, a difference of 0.29%), French Canadian (3.07, a difference of 0.33%), Norwegian (3.08, a difference of 0.57%), and German (3.09, a difference of 0.80%).
| Demographics | Rating | Rank | Average Family Size |
| Estonians | 0.0 /100 | #333 | Tragic 3.10 |
| Lithuanians | 0.0 /100 | #334 | Tragic 3.10 |
| Luxembourgers | 0.0 /100 | #335 | Tragic 3.10 |
| Irish | 0.0 /100 | #336 | Tragic 3.10 |
| Swedes | 0.0 /100 | #337 | Tragic 3.10 |
| French | 0.0 /100 | #338 | Tragic 3.10 |
| Croatians | 0.0 /100 | #339 | Tragic 3.10 |
| Finns | 0.0 /100 | #340 | Tragic 3.09 |
| Poles | 0.0 /100 | #341 | Tragic 3.09 |
| Germans | 0.0 /100 | #342 | Tragic 3.09 |
| Norwegians | 0.0 /100 | #343 | Tragic 3.08 |
| French Canadians | 0.0 /100 | #344 | Tragic 3.07 |
| Slovenes | 0.0 /100 | #345 | Tragic 3.07 |
| Slovaks | 0.0 /100 | #346 | Tragic 3.06 |
| Carpatho Rusyns | 0.0 /100 | #347 | Tragic 3.06 |