Delaware vs Immigrants from Singapore Average Family Size
COMPARE
Delaware
Immigrants from Singapore
Average Family Size
Average Family Size Comparison
Delaware
Immigrants from Singapore
3.20
AVERAGE FAMILY SIZE
11.1/ 100
METRIC RATING
215th/ 347
METRIC RANK
3.16
AVERAGE FAMILY SIZE
0.7/ 100
METRIC RATING
269th/ 347
METRIC RANK
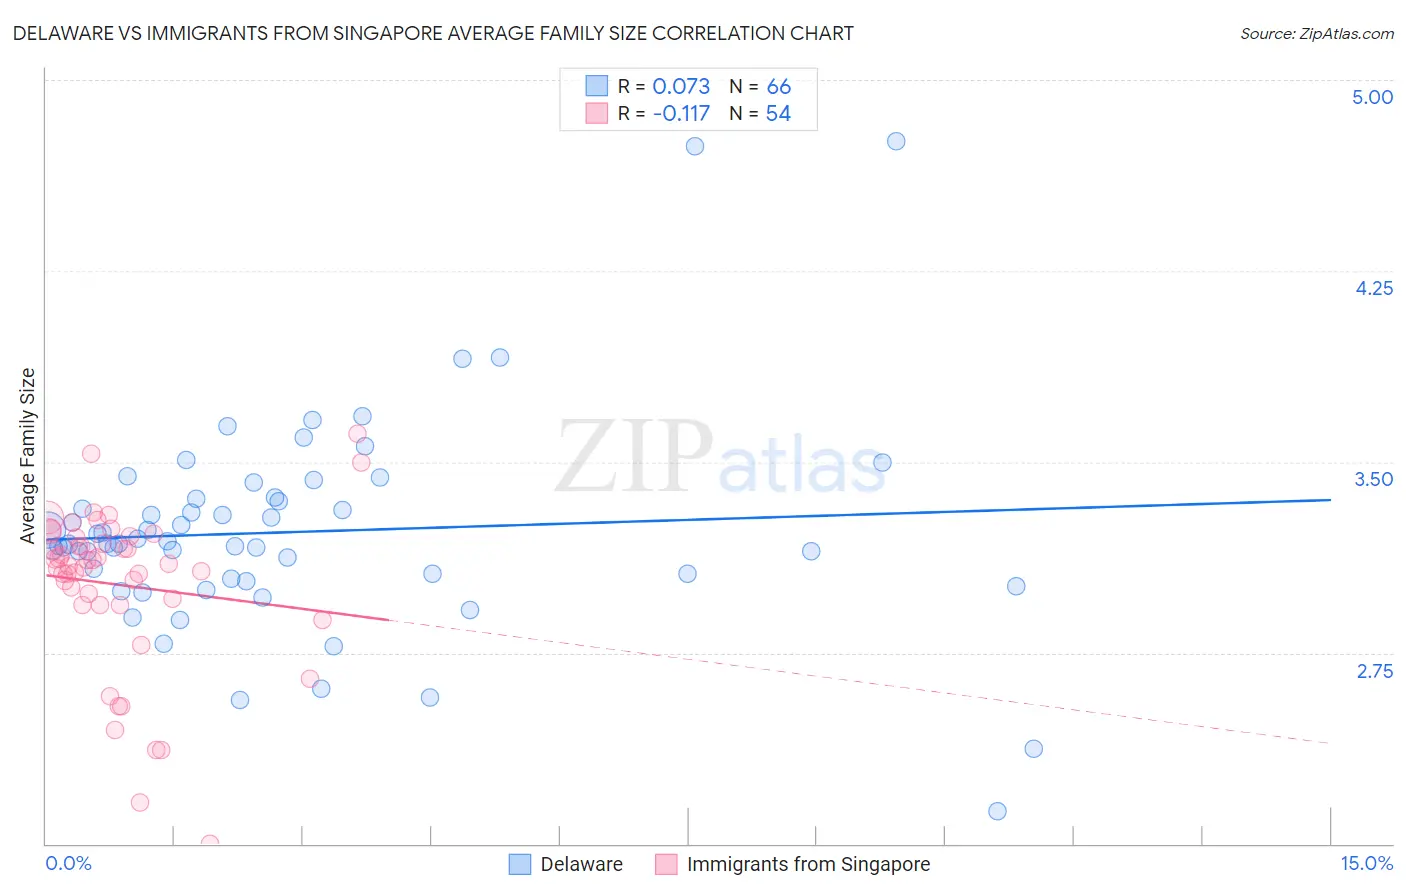
Delaware vs Immigrants from Singapore Average Family Size Correlation Chart
The statistical analysis conducted on geographies consisting of 96,226,564 people shows a slight positive correlation between the proportion of Delaware and average family size in the United States with a correlation coefficient (R) of 0.073 and weighted average of 3.20. Similarly, the statistical analysis conducted on geographies consisting of 137,456,280 people shows a poor negative correlation between the proportion of Immigrants from Singapore and average family size in the United States with a correlation coefficient (R) of -0.117 and weighted average of 3.16, a difference of 1.3%.
Average Family Size Correlation Summary
| Measurement | Delaware | Immigrants from Singapore |
| Minimum | 2.13 | 2.00 |
| Maximum | 4.76 | 3.61 |
| Range | 2.63 | 1.61 |
| Mean | 3.22 | 3.02 |
| Median | 3.18 | 3.09 |
| Interquartile 25% (IQ1) | 3.04 | 2.94 |
| Interquartile 75% (IQ3) | 3.35 | 3.20 |
| Interquartile Range (IQR) | 0.31 | 0.27 |
| Standard Deviation (Sample) | 0.41 | 0.32 |
| Standard Deviation (Population) | 0.41 | 0.32 |
Similar Demographics by Average Family Size
Demographics Similar to Delaware by Average Family Size
In terms of average family size, the demographic groups most similar to Delaware are Bermudan (3.20, a difference of 0.0%), Somali (3.20, a difference of 0.010%), Mongolian (3.20, a difference of 0.020%), Immigrants from Somalia (3.20, a difference of 0.040%), and Immigrants from Iran (3.20, a difference of 0.050%).
| Demographics | Rating | Rank | Average Family Size |
| Chippewa | 13.3 /100 | #208 | Poor 3.20 |
| Sudanese | 13.3 /100 | #209 | Poor 3.20 |
| Zimbabweans | 12.6 /100 | #210 | Poor 3.20 |
| Immigrants | Iran | 12.1 /100 | #211 | Poor 3.20 |
| Creek | 12.1 /100 | #212 | Poor 3.20 |
| Mongolians | 11.5 /100 | #213 | Poor 3.20 |
| Somalis | 11.2 /100 | #214 | Poor 3.20 |
| Delaware | 11.1 /100 | #215 | Poor 3.20 |
| Bermudans | 11.0 /100 | #216 | Poor 3.20 |
| Immigrants | Somalia | 10.3 /100 | #217 | Poor 3.20 |
| French American Indians | 9.8 /100 | #218 | Tragic 3.20 |
| Pennsylvania Germans | 9.3 /100 | #219 | Tragic 3.19 |
| Lebanese | 9.1 /100 | #220 | Tragic 3.19 |
| Immigrants | Ukraine | 7.2 /100 | #221 | Tragic 3.19 |
| Immigrants | Kuwait | 7.2 /100 | #222 | Tragic 3.19 |
Demographics Similar to Immigrants from Singapore by Average Family Size
In terms of average family size, the demographic groups most similar to Immigrants from Singapore are Maltese (3.16, a difference of 0.010%), Tlingit-Haida (3.16, a difference of 0.030%), Iroquois (3.16, a difference of 0.050%), Immigrants from Germany (3.15, a difference of 0.050%), and Immigrants from Greece (3.16, a difference of 0.070%).
| Demographics | Rating | Rank | Average Family Size |
| Immigrants | Russia | 1.3 /100 | #262 | Tragic 3.16 |
| Immigrants | Bulgaria | 1.0 /100 | #263 | Tragic 3.16 |
| Americans | 1.0 /100 | #264 | Tragic 3.16 |
| Immigrants | South Africa | 0.9 /100 | #265 | Tragic 3.16 |
| Immigrants | Greece | 0.9 /100 | #266 | Tragic 3.16 |
| Iroquois | 0.8 /100 | #267 | Tragic 3.16 |
| Maltese | 0.8 /100 | #268 | Tragic 3.16 |
| Immigrants | Singapore | 0.7 /100 | #269 | Tragic 3.16 |
| Tlingit-Haida | 0.7 /100 | #270 | Tragic 3.16 |
| Immigrants | Germany | 0.7 /100 | #271 | Tragic 3.15 |
| Immigrants | Lithuania | 0.6 /100 | #272 | Tragic 3.15 |
| New Zealanders | 0.6 /100 | #273 | Tragic 3.15 |
| Immigrants | Belgium | 0.6 /100 | #274 | Tragic 3.15 |
| Cambodians | 0.6 /100 | #275 | Tragic 3.15 |
| Immigrants | Bosnia and Herzegovina | 0.5 /100 | #276 | Tragic 3.15 |