Moroccan vs Slovak Average Family Size
COMPARE
Moroccan
Slovak
Average Family Size
Average Family Size Comparison
Moroccans
Slovaks
3.22
AVERAGE FAMILY SIZE
44.2/ 100
METRIC RATING
182nd/ 347
METRIC RANK
3.06
AVERAGE FAMILY SIZE
0.0/ 100
METRIC RATING
346th/ 347
METRIC RANK
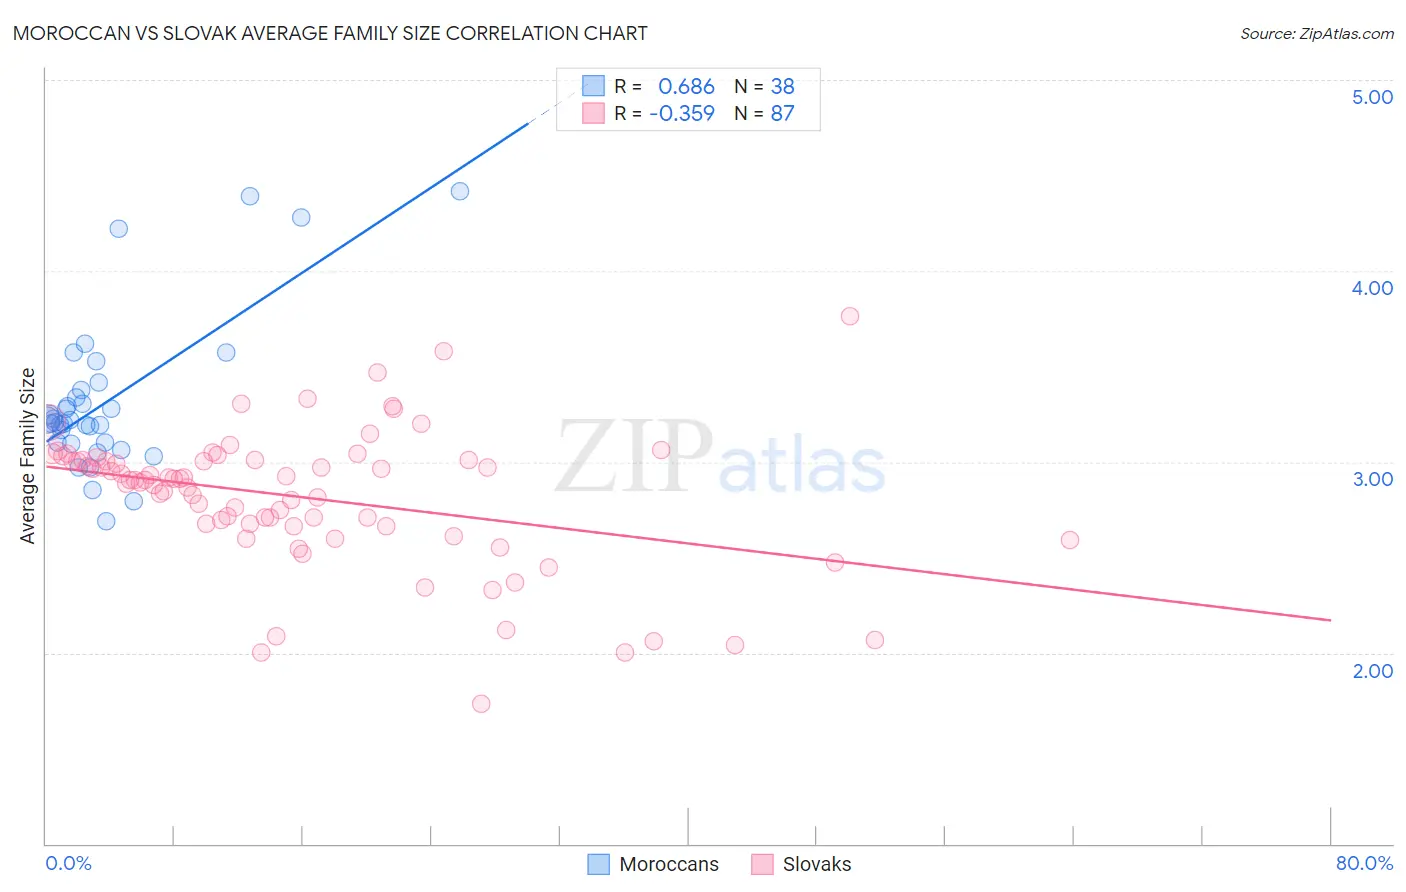
Moroccan vs Slovak Average Family Size Correlation Chart
The statistical analysis conducted on geographies consisting of 201,760,507 people shows a significant positive correlation between the proportion of Moroccans and average family size in the United States with a correlation coefficient (R) of 0.686 and weighted average of 3.22. Similarly, the statistical analysis conducted on geographies consisting of 397,683,086 people shows a mild negative correlation between the proportion of Slovaks and average family size in the United States with a correlation coefficient (R) of -0.359 and weighted average of 3.06, a difference of 5.2%.
Average Family Size Correlation Summary
| Measurement | Moroccan | Slovak |
| Minimum | 2.69 | 1.73 |
| Maximum | 4.42 | 3.76 |
| Range | 1.73 | 2.03 |
| Mean | 3.32 | 2.82 |
| Median | 3.21 | 2.91 |
| Interquartile 25% (IQ1) | 3.10 | 2.67 |
| Interquartile 75% (IQ3) | 3.38 | 3.01 |
| Interquartile Range (IQR) | 0.28 | 0.35 |
| Standard Deviation (Sample) | 0.40 | 0.36 |
| Standard Deviation (Population) | 0.40 | 0.36 |
Similar Demographics by Average Family Size
Demographics Similar to Moroccans by Average Family Size
In terms of average family size, the demographic groups most similar to Moroccans are Spanish (3.23, a difference of 0.010%), Palestinian (3.23, a difference of 0.040%), Spaniard (3.23, a difference of 0.050%), Immigrants from Korea (3.23, a difference of 0.050%), and Immigrants from Northern Africa (3.22, a difference of 0.050%).
| Demographics | Rating | Rank | Average Family Size |
| Immigrants | China | 49.9 /100 | #175 | Average 3.23 |
| Israelis | 48.7 /100 | #176 | Average 3.23 |
| Argentineans | 47.4 /100 | #177 | Average 3.23 |
| Spaniards | 47.2 /100 | #178 | Average 3.23 |
| Immigrants | Korea | 46.9 /100 | #179 | Average 3.23 |
| Palestinians | 46.6 /100 | #180 | Average 3.23 |
| Spanish | 44.8 /100 | #181 | Average 3.23 |
| Moroccans | 44.2 /100 | #182 | Average 3.22 |
| Immigrants | Northern Africa | 41.7 /100 | #183 | Average 3.22 |
| Immigrants | Eastern Asia | 40.8 /100 | #184 | Average 3.22 |
| Immigrants | Sri Lanka | 39.8 /100 | #185 | Fair 3.22 |
| Immigrants | Argentina | 39.8 /100 | #186 | Fair 3.22 |
| Immigrants | Malaysia | 39.0 /100 | #187 | Fair 3.22 |
| Thais | 38.3 /100 | #188 | Fair 3.22 |
| Pakistanis | 33.7 /100 | #189 | Fair 3.22 |
Demographics Similar to Slovaks by Average Family Size
In terms of average family size, the demographic groups most similar to Slovaks are Carpatho Rusyn (3.06, a difference of 0.060%), Slovene (3.07, a difference of 0.29%), French Canadian (3.07, a difference of 0.33%), Norwegian (3.08, a difference of 0.57%), and German (3.09, a difference of 0.80%).
| Demographics | Rating | Rank | Average Family Size |
| Estonians | 0.0 /100 | #333 | Tragic 3.10 |
| Lithuanians | 0.0 /100 | #334 | Tragic 3.10 |
| Luxembourgers | 0.0 /100 | #335 | Tragic 3.10 |
| Irish | 0.0 /100 | #336 | Tragic 3.10 |
| Swedes | 0.0 /100 | #337 | Tragic 3.10 |
| French | 0.0 /100 | #338 | Tragic 3.10 |
| Croatians | 0.0 /100 | #339 | Tragic 3.10 |
| Finns | 0.0 /100 | #340 | Tragic 3.09 |
| Poles | 0.0 /100 | #341 | Tragic 3.09 |
| Germans | 0.0 /100 | #342 | Tragic 3.09 |
| Norwegians | 0.0 /100 | #343 | Tragic 3.08 |
| French Canadians | 0.0 /100 | #344 | Tragic 3.07 |
| Slovenes | 0.0 /100 | #345 | Tragic 3.07 |
| Slovaks | 0.0 /100 | #346 | Tragic 3.06 |
| Carpatho Rusyns | 0.0 /100 | #347 | Tragic 3.06 |