Delaware vs Palestinian Average Family Size
COMPARE
Delaware
Palestinian
Average Family Size
Average Family Size Comparison
Delaware
Palestinians
3.20
AVERAGE FAMILY SIZE
11.1/ 100
METRIC RATING
215th/ 347
METRIC RANK
3.23
AVERAGE FAMILY SIZE
46.6/ 100
METRIC RATING
180th/ 347
METRIC RANK
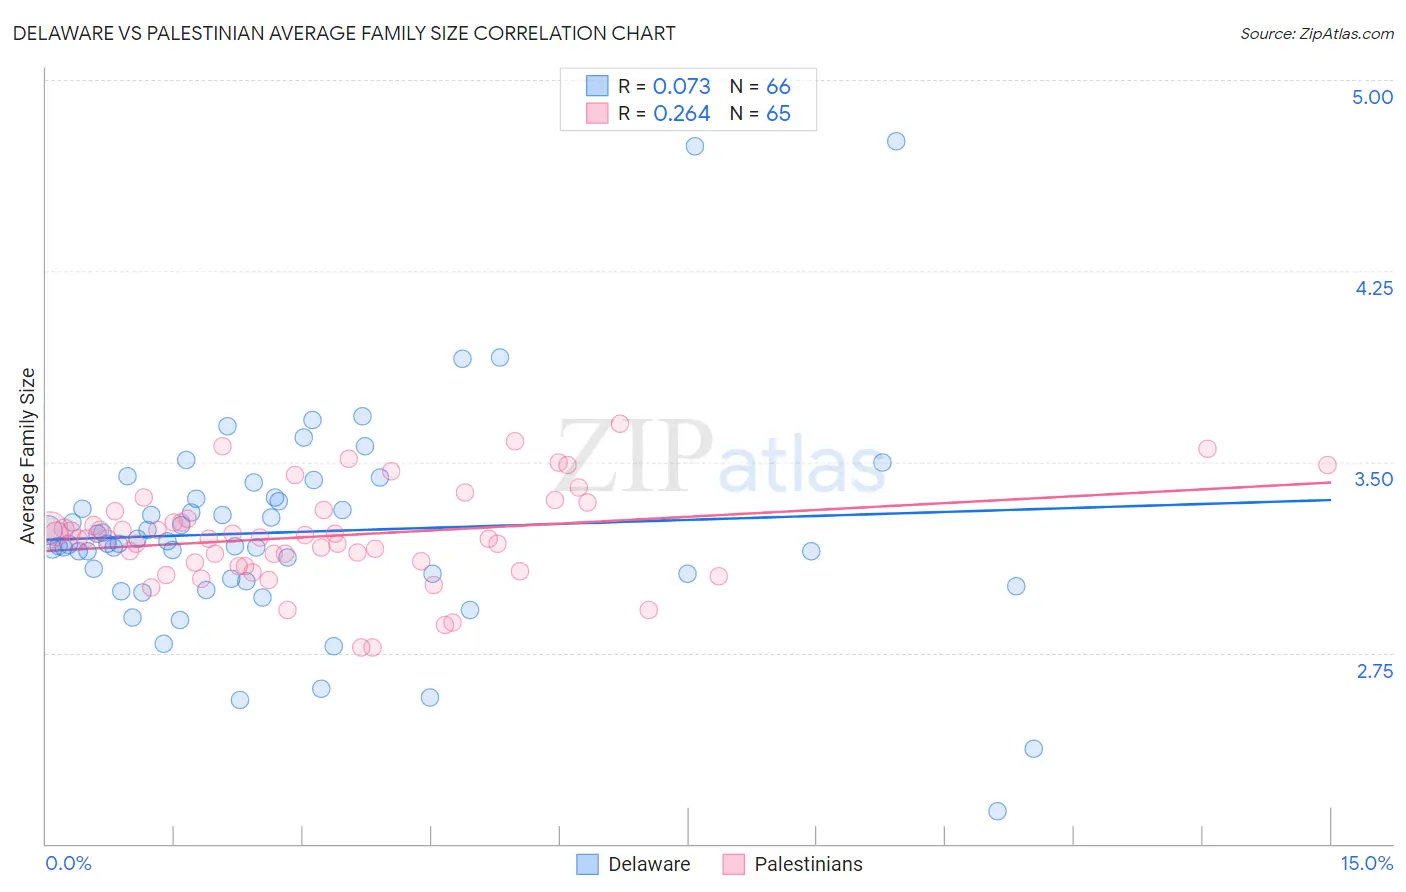
Delaware vs Palestinian Average Family Size Correlation Chart
The statistical analysis conducted on geographies consisting of 96,226,564 people shows a slight positive correlation between the proportion of Delaware and average family size in the United States with a correlation coefficient (R) of 0.073 and weighted average of 3.20. Similarly, the statistical analysis conducted on geographies consisting of 216,402,658 people shows a weak positive correlation between the proportion of Palestinians and average family size in the United States with a correlation coefficient (R) of 0.264 and weighted average of 3.23, a difference of 0.90%.
Average Family Size Correlation Summary
| Measurement | Delaware | Palestinian |
| Minimum | 2.13 | 2.77 |
| Maximum | 4.76 | 3.65 |
| Range | 2.63 | 0.88 |
| Mean | 3.22 | 3.21 |
| Median | 3.18 | 3.20 |
| Interquartile 25% (IQ1) | 3.04 | 3.10 |
| Interquartile 75% (IQ3) | 3.35 | 3.31 |
| Interquartile Range (IQR) | 0.31 | 0.21 |
| Standard Deviation (Sample) | 0.41 | 0.19 |
| Standard Deviation (Population) | 0.41 | 0.19 |
Similar Demographics by Average Family Size
Demographics Similar to Delaware by Average Family Size
In terms of average family size, the demographic groups most similar to Delaware are Bermudan (3.20, a difference of 0.0%), Somali (3.20, a difference of 0.010%), Mongolian (3.20, a difference of 0.020%), Immigrants from Somalia (3.20, a difference of 0.040%), and Immigrants from Iran (3.20, a difference of 0.050%).
| Demographics | Rating | Rank | Average Family Size |
| Chippewa | 13.3 /100 | #208 | Poor 3.20 |
| Sudanese | 13.3 /100 | #209 | Poor 3.20 |
| Zimbabweans | 12.6 /100 | #210 | Poor 3.20 |
| Immigrants | Iran | 12.1 /100 | #211 | Poor 3.20 |
| Creek | 12.1 /100 | #212 | Poor 3.20 |
| Mongolians | 11.5 /100 | #213 | Poor 3.20 |
| Somalis | 11.2 /100 | #214 | Poor 3.20 |
| Delaware | 11.1 /100 | #215 | Poor 3.20 |
| Bermudans | 11.0 /100 | #216 | Poor 3.20 |
| Immigrants | Somalia | 10.3 /100 | #217 | Poor 3.20 |
| French American Indians | 9.8 /100 | #218 | Tragic 3.20 |
| Pennsylvania Germans | 9.3 /100 | #219 | Tragic 3.19 |
| Lebanese | 9.1 /100 | #220 | Tragic 3.19 |
| Immigrants | Ukraine | 7.2 /100 | #221 | Tragic 3.19 |
| Immigrants | Kuwait | 7.2 /100 | #222 | Tragic 3.19 |
Demographics Similar to Palestinians by Average Family Size
In terms of average family size, the demographic groups most similar to Palestinians are Argentinean (3.23, a difference of 0.010%), Spaniard (3.23, a difference of 0.010%), Immigrants from Korea (3.23, a difference of 0.010%), Spanish (3.23, a difference of 0.030%), and Israeli (3.23, a difference of 0.040%).
| Demographics | Rating | Rank | Average Family Size |
| Immigrants | Uruguay | 52.0 /100 | #173 | Average 3.23 |
| Immigrants | South Central Asia | 50.0 /100 | #174 | Average 3.23 |
| Immigrants | China | 49.9 /100 | #175 | Average 3.23 |
| Israelis | 48.7 /100 | #176 | Average 3.23 |
| Argentineans | 47.4 /100 | #177 | Average 3.23 |
| Spaniards | 47.2 /100 | #178 | Average 3.23 |
| Immigrants | Korea | 46.9 /100 | #179 | Average 3.23 |
| Palestinians | 46.6 /100 | #180 | Average 3.23 |
| Spanish | 44.8 /100 | #181 | Average 3.23 |
| Moroccans | 44.2 /100 | #182 | Average 3.22 |
| Immigrants | Northern Africa | 41.7 /100 | #183 | Average 3.22 |
| Immigrants | Eastern Asia | 40.8 /100 | #184 | Average 3.22 |
| Immigrants | Sri Lanka | 39.8 /100 | #185 | Fair 3.22 |
| Immigrants | Argentina | 39.8 /100 | #186 | Fair 3.22 |
| Immigrants | Malaysia | 39.0 /100 | #187 | Fair 3.22 |