Delaware vs Czechoslovakian Average Family Size
COMPARE
Delaware
Czechoslovakian
Average Family Size
Average Family Size Comparison
Delaware
Czechoslovakians
3.20
AVERAGE FAMILY SIZE
11.1/ 100
METRIC RATING
215th/ 347
METRIC RANK
3.13
AVERAGE FAMILY SIZE
0.1/ 100
METRIC RATING
310th/ 347
METRIC RANK
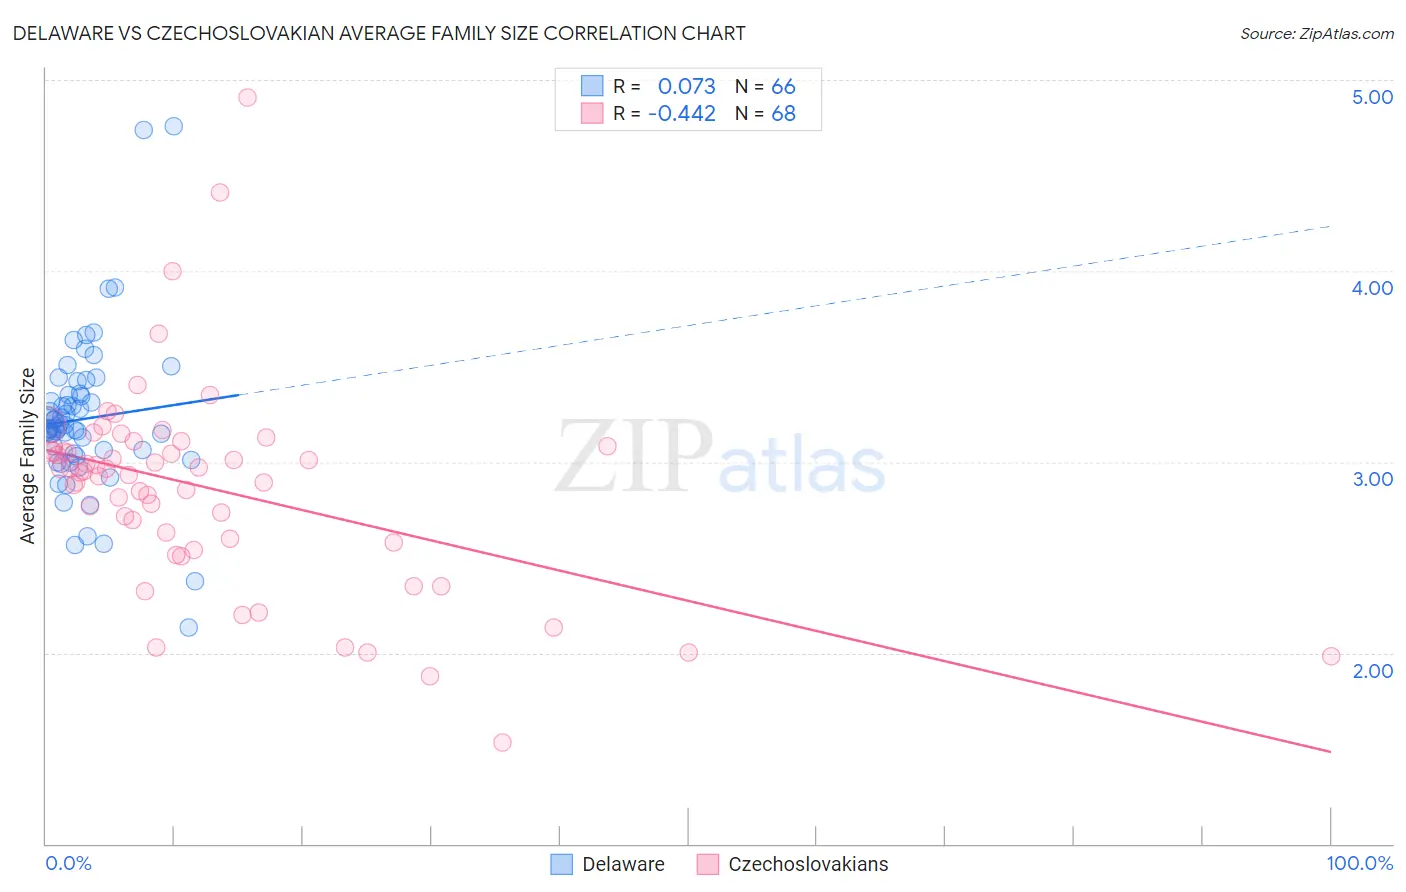
Delaware vs Czechoslovakian Average Family Size Correlation Chart
The statistical analysis conducted on geographies consisting of 96,226,564 people shows a slight positive correlation between the proportion of Delaware and average family size in the United States with a correlation coefficient (R) of 0.073 and weighted average of 3.20. Similarly, the statistical analysis conducted on geographies consisting of 368,525,385 people shows a moderate negative correlation between the proportion of Czechoslovakians and average family size in the United States with a correlation coefficient (R) of -0.442 and weighted average of 3.13, a difference of 2.2%.
Average Family Size Correlation Summary
| Measurement | Delaware | Czechoslovakian |
| Minimum | 2.13 | 1.53 |
| Maximum | 4.76 | 4.91 |
| Range | 2.63 | 3.38 |
| Mean | 3.22 | 2.86 |
| Median | 3.18 | 2.95 |
| Interquartile 25% (IQ1) | 3.04 | 2.59 |
| Interquartile 75% (IQ3) | 3.35 | 3.07 |
| Interquartile Range (IQR) | 0.31 | 0.48 |
| Standard Deviation (Sample) | 0.41 | 0.54 |
| Standard Deviation (Population) | 0.41 | 0.54 |
Similar Demographics by Average Family Size
Demographics Similar to Delaware by Average Family Size
In terms of average family size, the demographic groups most similar to Delaware are Bermudan (3.20, a difference of 0.0%), Somali (3.20, a difference of 0.010%), Mongolian (3.20, a difference of 0.020%), Immigrants from Somalia (3.20, a difference of 0.040%), and Immigrants from Iran (3.20, a difference of 0.050%).
| Demographics | Rating | Rank | Average Family Size |
| Chippewa | 13.3 /100 | #208 | Poor 3.20 |
| Sudanese | 13.3 /100 | #209 | Poor 3.20 |
| Zimbabweans | 12.6 /100 | #210 | Poor 3.20 |
| Immigrants | Iran | 12.1 /100 | #211 | Poor 3.20 |
| Creek | 12.1 /100 | #212 | Poor 3.20 |
| Mongolians | 11.5 /100 | #213 | Poor 3.20 |
| Somalis | 11.2 /100 | #214 | Poor 3.20 |
| Delaware | 11.1 /100 | #215 | Poor 3.20 |
| Bermudans | 11.0 /100 | #216 | Poor 3.20 |
| Immigrants | Somalia | 10.3 /100 | #217 | Poor 3.20 |
| French American Indians | 9.8 /100 | #218 | Tragic 3.20 |
| Pennsylvania Germans | 9.3 /100 | #219 | Tragic 3.19 |
| Lebanese | 9.1 /100 | #220 | Tragic 3.19 |
| Immigrants | Ukraine | 7.2 /100 | #221 | Tragic 3.19 |
| Immigrants | Kuwait | 7.2 /100 | #222 | Tragic 3.19 |
Demographics Similar to Czechoslovakians by Average Family Size
In terms of average family size, the demographic groups most similar to Czechoslovakians are Northern European (3.13, a difference of 0.020%), Slavic (3.13, a difference of 0.030%), Immigrants from Northern Europe (3.13, a difference of 0.040%), Immigrants from Australia (3.13, a difference of 0.060%), and Bulgarian (3.13, a difference of 0.070%).
| Demographics | Rating | Rank | Average Family Size |
| British | 0.2 /100 | #303 | Tragic 3.13 |
| Immigrants | Switzerland | 0.2 /100 | #304 | Tragic 3.13 |
| Australians | 0.1 /100 | #305 | Tragic 3.13 |
| Immigrants | Ireland | 0.1 /100 | #306 | Tragic 3.13 |
| Immigrants | Serbia | 0.1 /100 | #307 | Tragic 3.13 |
| Slavs | 0.1 /100 | #308 | Tragic 3.13 |
| Northern Europeans | 0.1 /100 | #309 | Tragic 3.13 |
| Czechoslovakians | 0.1 /100 | #310 | Tragic 3.13 |
| Immigrants | Northern Europe | 0.1 /100 | #311 | Tragic 3.13 |
| Immigrants | Australia | 0.1 /100 | #312 | Tragic 3.13 |
| Bulgarians | 0.1 /100 | #313 | Tragic 3.13 |
| Russians | 0.1 /100 | #314 | Tragic 3.12 |
| Immigrants | Scotland | 0.1 /100 | #315 | Tragic 3.12 |
| Serbians | 0.1 /100 | #316 | Tragic 3.12 |
| Italians | 0.1 /100 | #317 | Tragic 3.12 |