Immigrants from Asia vs Slovak Average Family Size
COMPARE
Immigrants from Asia
Slovak
Average Family Size
Average Family Size Comparison
Immigrants from Asia
Slovaks
3.27
AVERAGE FAMILY SIZE
94.0/ 100
METRIC RATING
118th/ 347
METRIC RANK
3.06
AVERAGE FAMILY SIZE
0.0/ 100
METRIC RATING
346th/ 347
METRIC RANK
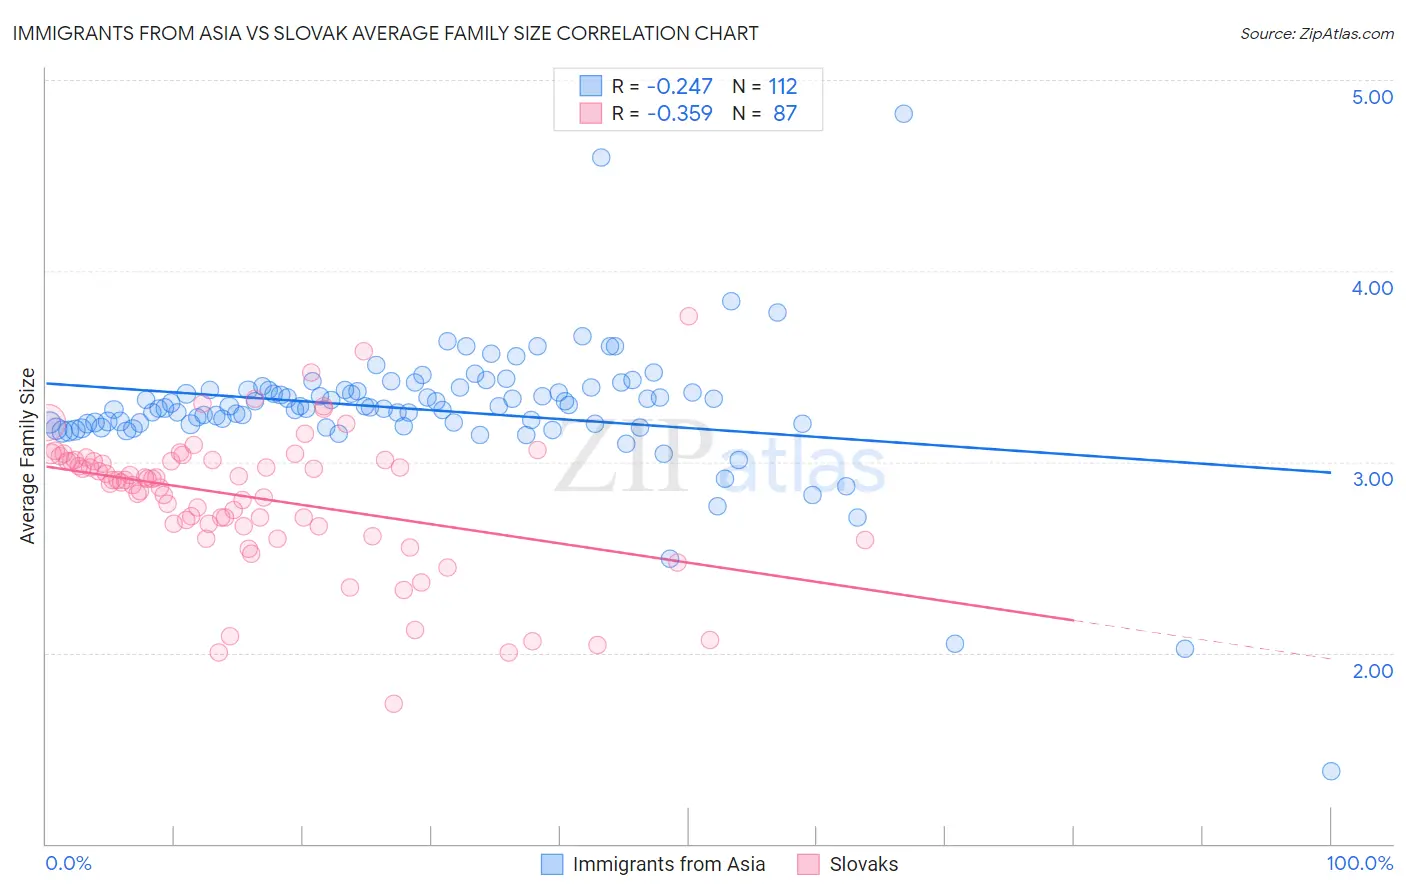
Immigrants from Asia vs Slovak Average Family Size Correlation Chart
The statistical analysis conducted on geographies consisting of 548,543,800 people shows a weak negative correlation between the proportion of Immigrants from Asia and average family size in the United States with a correlation coefficient (R) of -0.247 and weighted average of 3.27. Similarly, the statistical analysis conducted on geographies consisting of 397,683,086 people shows a mild negative correlation between the proportion of Slovaks and average family size in the United States with a correlation coefficient (R) of -0.359 and weighted average of 3.06, a difference of 6.7%.
Average Family Size Correlation Summary
| Measurement | Immigrants from Asia | Slovak |
| Minimum | 1.38 | 1.73 |
| Maximum | 4.82 | 3.76 |
| Range | 3.44 | 2.03 |
| Mean | 3.27 | 2.82 |
| Median | 3.29 | 2.91 |
| Interquartile 25% (IQ1) | 3.20 | 2.67 |
| Interquartile 75% (IQ3) | 3.38 | 3.01 |
| Interquartile Range (IQR) | 0.18 | 0.35 |
| Standard Deviation (Sample) | 0.37 | 0.36 |
| Standard Deviation (Population) | 0.36 | 0.36 |
Similar Demographics by Average Family Size
Demographics Similar to Immigrants from Asia by Average Family Size
In terms of average family size, the demographic groups most similar to Immigrants from Asia are Immigrants from Indonesia (3.27, a difference of 0.020%), Immigrants from Bahamas (3.27, a difference of 0.030%), Immigrants from Thailand (3.27, a difference of 0.050%), Kiowa (3.27, a difference of 0.070%), and Immigrants from Liberia (3.27, a difference of 0.090%).
| Demographics | Rating | Rank | Average Family Size |
| Indonesians | 96.2 /100 | #111 | Exceptional 3.28 |
| Blacks/African Americans | 95.7 /100 | #112 | Exceptional 3.27 |
| Immigrants | Panama | 95.6 /100 | #113 | Exceptional 3.27 |
| South Americans | 95.1 /100 | #114 | Exceptional 3.27 |
| Immigrants | Liberia | 95.0 /100 | #115 | Exceptional 3.27 |
| Immigrants | South America | 95.0 /100 | #116 | Exceptional 3.27 |
| Kiowa | 94.8 /100 | #117 | Exceptional 3.27 |
| Immigrants | Asia | 94.0 /100 | #118 | Exceptional 3.27 |
| Immigrants | Indonesia | 93.7 /100 | #119 | Exceptional 3.27 |
| Immigrants | Bahamas | 93.6 /100 | #120 | Exceptional 3.27 |
| Immigrants | Thailand | 93.3 /100 | #121 | Exceptional 3.27 |
| Immigrants | Colombia | 92.8 /100 | #122 | Exceptional 3.27 |
| Alaskan Athabascans | 92.4 /100 | #123 | Exceptional 3.27 |
| South American Indians | 91.6 /100 | #124 | Exceptional 3.26 |
| Immigrants | Cuba | 91.3 /100 | #125 | Exceptional 3.26 |
Demographics Similar to Slovaks by Average Family Size
In terms of average family size, the demographic groups most similar to Slovaks are Carpatho Rusyn (3.06, a difference of 0.060%), Slovene (3.07, a difference of 0.29%), French Canadian (3.07, a difference of 0.33%), Norwegian (3.08, a difference of 0.57%), and German (3.09, a difference of 0.80%).
| Demographics | Rating | Rank | Average Family Size |
| Estonians | 0.0 /100 | #333 | Tragic 3.10 |
| Lithuanians | 0.0 /100 | #334 | Tragic 3.10 |
| Luxembourgers | 0.0 /100 | #335 | Tragic 3.10 |
| Irish | 0.0 /100 | #336 | Tragic 3.10 |
| Swedes | 0.0 /100 | #337 | Tragic 3.10 |
| French | 0.0 /100 | #338 | Tragic 3.10 |
| Croatians | 0.0 /100 | #339 | Tragic 3.10 |
| Finns | 0.0 /100 | #340 | Tragic 3.09 |
| Poles | 0.0 /100 | #341 | Tragic 3.09 |
| Germans | 0.0 /100 | #342 | Tragic 3.09 |
| Norwegians | 0.0 /100 | #343 | Tragic 3.08 |
| French Canadians | 0.0 /100 | #344 | Tragic 3.07 |
| Slovenes | 0.0 /100 | #345 | Tragic 3.07 |
| Slovaks | 0.0 /100 | #346 | Tragic 3.06 |
| Carpatho Rusyns | 0.0 /100 | #347 | Tragic 3.06 |