Delaware vs Immigrants from Senegal Average Family Size
COMPARE
Delaware
Immigrants from Senegal
Average Family Size
Average Family Size Comparison
Delaware
Immigrants from Senegal
3.20
AVERAGE FAMILY SIZE
11.1/ 100
METRIC RATING
215th/ 347
METRIC RANK
3.23
AVERAGE FAMILY SIZE
57.5/ 100
METRIC RATING
166th/ 347
METRIC RANK
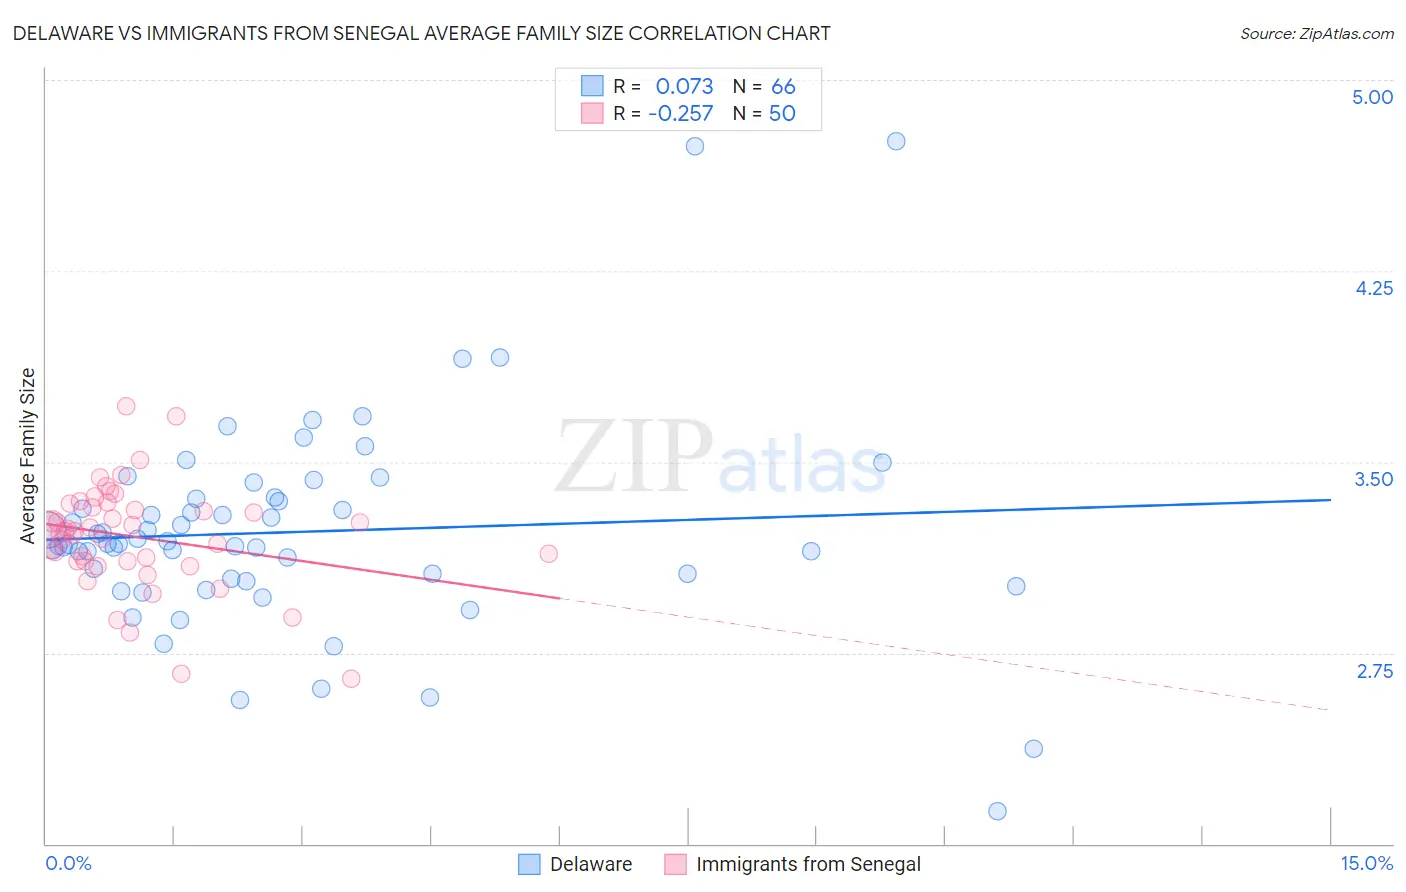
Delaware vs Immigrants from Senegal Average Family Size Correlation Chart
The statistical analysis conducted on geographies consisting of 96,226,564 people shows a slight positive correlation between the proportion of Delaware and average family size in the United States with a correlation coefficient (R) of 0.073 and weighted average of 3.20. Similarly, the statistical analysis conducted on geographies consisting of 90,123,819 people shows a weak negative correlation between the proportion of Immigrants from Senegal and average family size in the United States with a correlation coefficient (R) of -0.257 and weighted average of 3.23, a difference of 1.1%.
Average Family Size Correlation Summary
| Measurement | Delaware | Immigrants from Senegal |
| Minimum | 2.13 | 2.65 |
| Maximum | 4.76 | 3.72 |
| Range | 2.63 | 1.07 |
| Mean | 3.22 | 3.21 |
| Median | 3.18 | 3.23 |
| Interquartile 25% (IQ1) | 3.04 | 3.11 |
| Interquartile 75% (IQ3) | 3.35 | 3.32 |
| Interquartile Range (IQR) | 0.31 | 0.21 |
| Standard Deviation (Sample) | 0.41 | 0.21 |
| Standard Deviation (Population) | 0.41 | 0.21 |
Similar Demographics by Average Family Size
Demographics Similar to Delaware by Average Family Size
In terms of average family size, the demographic groups most similar to Delaware are Bermudan (3.20, a difference of 0.0%), Somali (3.20, a difference of 0.010%), Mongolian (3.20, a difference of 0.020%), Immigrants from Somalia (3.20, a difference of 0.040%), and Immigrants from Iran (3.20, a difference of 0.050%).
| Demographics | Rating | Rank | Average Family Size |
| Chippewa | 13.3 /100 | #208 | Poor 3.20 |
| Sudanese | 13.3 /100 | #209 | Poor 3.20 |
| Zimbabweans | 12.6 /100 | #210 | Poor 3.20 |
| Immigrants | Iran | 12.1 /100 | #211 | Poor 3.20 |
| Creek | 12.1 /100 | #212 | Poor 3.20 |
| Mongolians | 11.5 /100 | #213 | Poor 3.20 |
| Somalis | 11.2 /100 | #214 | Poor 3.20 |
| Delaware | 11.1 /100 | #215 | Poor 3.20 |
| Bermudans | 11.0 /100 | #216 | Poor 3.20 |
| Immigrants | Somalia | 10.3 /100 | #217 | Poor 3.20 |
| French American Indians | 9.8 /100 | #218 | Tragic 3.20 |
| Pennsylvania Germans | 9.3 /100 | #219 | Tragic 3.19 |
| Lebanese | 9.1 /100 | #220 | Tragic 3.19 |
| Immigrants | Ukraine | 7.2 /100 | #221 | Tragic 3.19 |
| Immigrants | Kuwait | 7.2 /100 | #222 | Tragic 3.19 |
Demographics Similar to Immigrants from Senegal by Average Family Size
In terms of average family size, the demographic groups most similar to Immigrants from Senegal are Dutch West Indian (3.23, a difference of 0.010%), Egyptian (3.23, a difference of 0.020%), Ugandan (3.23, a difference of 0.020%), Uruguayan (3.23, a difference of 0.030%), and Immigrants from Uganda (3.23, a difference of 0.050%).
| Demographics | Rating | Rank | Average Family Size |
| Ethiopians | 63.9 /100 | #159 | Good 3.24 |
| Immigrants | Iraq | 63.7 /100 | #160 | Good 3.24 |
| Immigrants | Chile | 63.2 /100 | #161 | Good 3.24 |
| Immigrants | Uganda | 60.1 /100 | #162 | Good 3.23 |
| Uruguayans | 58.8 /100 | #163 | Average 3.23 |
| Egyptians | 58.6 /100 | #164 | Average 3.23 |
| Ugandans | 58.4 /100 | #165 | Average 3.23 |
| Immigrants | Senegal | 57.5 /100 | #166 | Average 3.23 |
| Dutch West Indians | 56.9 /100 | #167 | Average 3.23 |
| Taiwanese | 54.2 /100 | #168 | Average 3.23 |
| Aleuts | 54.1 /100 | #169 | Average 3.23 |
| Arabs | 53.8 /100 | #170 | Average 3.23 |
| Chileans | 53.2 /100 | #171 | Average 3.23 |
| Immigrants | Congo | 52.7 /100 | #172 | Average 3.23 |
| Immigrants | Uruguay | 52.0 /100 | #173 | Average 3.23 |