Delaware vs Immigrants from Nepal Average Family Size
COMPARE
Delaware
Immigrants from Nepal
Average Family Size
Average Family Size Comparison
Delaware
Immigrants from Nepal
3.20
AVERAGE FAMILY SIZE
11.1/ 100
METRIC RATING
215th/ 347
METRIC RANK
3.21
AVERAGE FAMILY SIZE
18.1/ 100
METRIC RATING
203rd/ 347
METRIC RANK
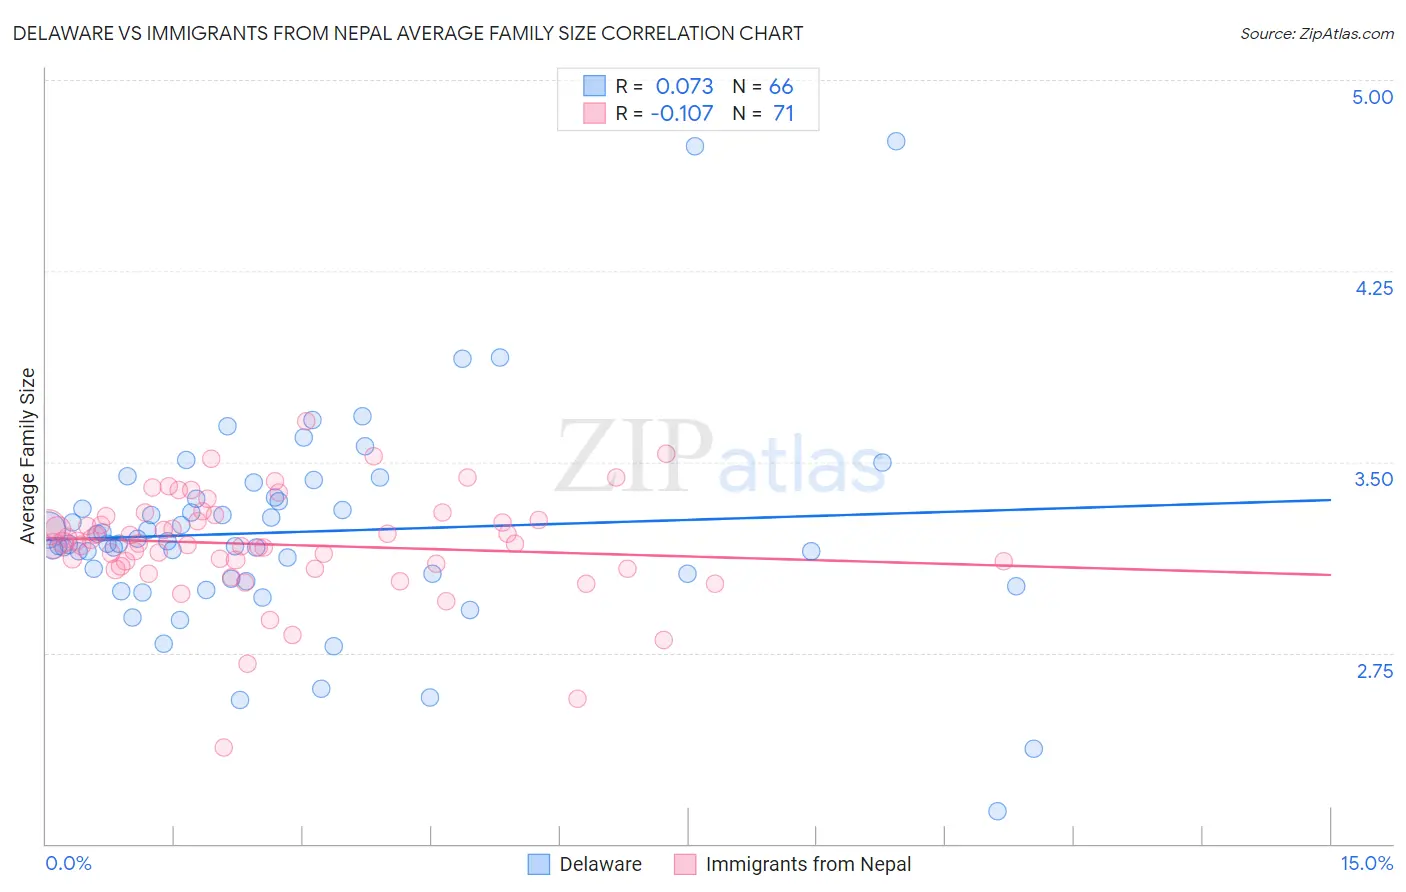
Delaware vs Immigrants from Nepal Average Family Size Correlation Chart
The statistical analysis conducted on geographies consisting of 96,226,564 people shows a slight positive correlation between the proportion of Delaware and average family size in the United States with a correlation coefficient (R) of 0.073 and weighted average of 3.20. Similarly, the statistical analysis conducted on geographies consisting of 186,665,841 people shows a poor negative correlation between the proportion of Immigrants from Nepal and average family size in the United States with a correlation coefficient (R) of -0.107 and weighted average of 3.21, a difference of 0.26%.
Average Family Size Correlation Summary
| Measurement | Delaware | Immigrants from Nepal |
| Minimum | 2.13 | 2.38 |
| Maximum | 4.76 | 3.66 |
| Range | 2.63 | 1.28 |
| Mean | 3.22 | 3.18 |
| Median | 3.18 | 3.18 |
| Interquartile 25% (IQ1) | 3.04 | 3.09 |
| Interquartile 75% (IQ3) | 3.35 | 3.29 |
| Interquartile Range (IQR) | 0.31 | 0.19 |
| Standard Deviation (Sample) | 0.41 | 0.21 |
| Standard Deviation (Population) | 0.41 | 0.21 |
Demographics Similar to Delaware and Immigrants from Nepal by Average Family Size
In terms of average family size, the demographic groups most similar to Delaware are Bermudan (3.20, a difference of 0.0%), Somali (3.20, a difference of 0.010%), Mongolian (3.20, a difference of 0.020%), Immigrants from Somalia (3.20, a difference of 0.040%), and Immigrants from Iran (3.20, a difference of 0.050%). Similarly, the demographic groups most similar to Immigrants from Nepal are Immigrants from Morocco (3.21, a difference of 0.010%), Immigrants from India (3.21, a difference of 0.010%), Immigrants from Kenya (3.21, a difference of 0.030%), Immigrants from Poland (3.20, a difference of 0.050%), and Paraguayan (3.20, a difference of 0.060%).
| Demographics | Rating | Rank | Average Family Size |
| Hmong | 20.7 /100 | #199 | Fair 3.21 |
| Immigrants | Kenya | 19.2 /100 | #200 | Poor 3.21 |
| Immigrants | Morocco | 18.5 /100 | #201 | Poor 3.21 |
| Immigrants | India | 18.5 /100 | #202 | Poor 3.21 |
| Immigrants | Nepal | 18.1 /100 | #203 | Poor 3.21 |
| Immigrants | Poland | 16.6 /100 | #204 | Poor 3.20 |
| Paraguayans | 16.3 /100 | #205 | Poor 3.20 |
| Immigrants | Cabo Verde | 16.0 /100 | #206 | Poor 3.20 |
| Filipinos | 13.6 /100 | #207 | Poor 3.20 |
| Chippewa | 13.3 /100 | #208 | Poor 3.20 |
| Sudanese | 13.3 /100 | #209 | Poor 3.20 |
| Zimbabweans | 12.6 /100 | #210 | Poor 3.20 |
| Immigrants | Iran | 12.1 /100 | #211 | Poor 3.20 |
| Creek | 12.1 /100 | #212 | Poor 3.20 |
| Mongolians | 11.5 /100 | #213 | Poor 3.20 |
| Somalis | 11.2 /100 | #214 | Poor 3.20 |
| Delaware | 11.1 /100 | #215 | Poor 3.20 |
| Bermudans | 11.0 /100 | #216 | Poor 3.20 |
| Immigrants | Somalia | 10.3 /100 | #217 | Poor 3.20 |
| French American Indians | 9.8 /100 | #218 | Tragic 3.20 |
| Pennsylvania Germans | 9.3 /100 | #219 | Tragic 3.19 |