Delaware vs Arapaho Average Family Size
COMPARE
Delaware
Arapaho
Average Family Size
Average Family Size Comparison
Delaware
Arapaho
3.20
AVERAGE FAMILY SIZE
11.1/ 100
METRIC RATING
215th/ 347
METRIC RANK
3.64
AVERAGE FAMILY SIZE
100.0/ 100
METRIC RATING
6th/ 347
METRIC RANK
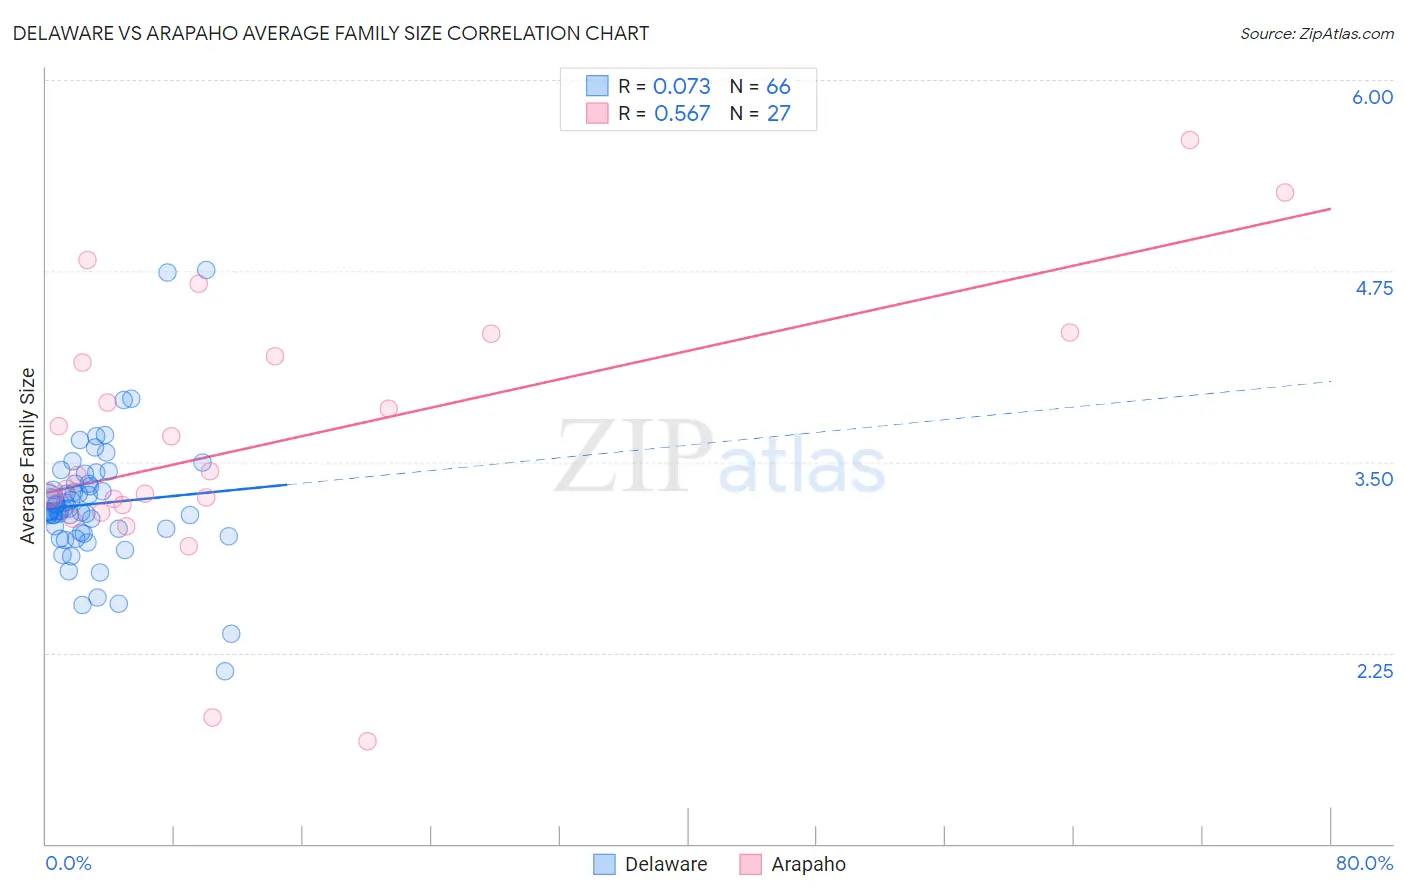
Delaware vs Arapaho Average Family Size Correlation Chart
The statistical analysis conducted on geographies consisting of 96,226,564 people shows a slight positive correlation between the proportion of Delaware and average family size in the United States with a correlation coefficient (R) of 0.073 and weighted average of 3.20. Similarly, the statistical analysis conducted on geographies consisting of 29,778,233 people shows a substantial positive correlation between the proportion of Arapaho and average family size in the United States with a correlation coefficient (R) of 0.567 and weighted average of 3.64, a difference of 13.7%.
Average Family Size Correlation Summary
| Measurement | Delaware | Arapaho |
| Minimum | 2.13 | 1.67 |
| Maximum | 4.76 | 5.61 |
| Range | 2.63 | 3.94 |
| Mean | 3.22 | 3.63 |
| Median | 3.18 | 3.42 |
| Interquartile 25% (IQ1) | 3.04 | 3.22 |
| Interquartile 75% (IQ3) | 3.35 | 4.19 |
| Interquartile Range (IQR) | 0.31 | 0.97 |
| Standard Deviation (Sample) | 0.41 | 0.88 |
| Standard Deviation (Population) | 0.41 | 0.86 |
Similar Demographics by Average Family Size
Demographics Similar to Delaware by Average Family Size
In terms of average family size, the demographic groups most similar to Delaware are Bermudan (3.20, a difference of 0.0%), Somali (3.20, a difference of 0.010%), Mongolian (3.20, a difference of 0.020%), Immigrants from Somalia (3.20, a difference of 0.040%), and Immigrants from Iran (3.20, a difference of 0.050%).
| Demographics | Rating | Rank | Average Family Size |
| Chippewa | 13.3 /100 | #208 | Poor 3.20 |
| Sudanese | 13.3 /100 | #209 | Poor 3.20 |
| Zimbabweans | 12.6 /100 | #210 | Poor 3.20 |
| Immigrants | Iran | 12.1 /100 | #211 | Poor 3.20 |
| Creek | 12.1 /100 | #212 | Poor 3.20 |
| Mongolians | 11.5 /100 | #213 | Poor 3.20 |
| Somalis | 11.2 /100 | #214 | Poor 3.20 |
| Delaware | 11.1 /100 | #215 | Poor 3.20 |
| Bermudans | 11.0 /100 | #216 | Poor 3.20 |
| Immigrants | Somalia | 10.3 /100 | #217 | Poor 3.20 |
| French American Indians | 9.8 /100 | #218 | Tragic 3.20 |
| Pennsylvania Germans | 9.3 /100 | #219 | Tragic 3.19 |
| Lebanese | 9.1 /100 | #220 | Tragic 3.19 |
| Immigrants | Ukraine | 7.2 /100 | #221 | Tragic 3.19 |
| Immigrants | Kuwait | 7.2 /100 | #222 | Tragic 3.19 |
Demographics Similar to Arapaho by Average Family Size
In terms of average family size, the demographic groups most similar to Arapaho are Inupiat (3.63, a difference of 0.22%), Navajo (3.65, a difference of 0.27%), Immigrants from Yemen (3.60, a difference of 1.1%), Hopi (3.60, a difference of 1.1%), and Spanish American Indian (3.58, a difference of 1.4%).
| Demographics | Rating | Rank | Average Family Size |
| Yup'ik | 100 /100 | #1 | Exceptional 4.00 |
| Crow | 100 /100 | #2 | Exceptional 3.82 |
| Pueblo | 100 /100 | #3 | Exceptional 3.79 |
| Pima | 100 /100 | #4 | Exceptional 3.75 |
| Navajo | 100.0 /100 | #5 | Exceptional 3.65 |
| Arapaho | 100.0 /100 | #6 | Exceptional 3.64 |
| Inupiat | 100.0 /100 | #7 | Exceptional 3.63 |
| Immigrants | Yemen | 100.0 /100 | #8 | Exceptional 3.60 |
| Hopi | 100.0 /100 | #9 | Exceptional 3.60 |
| Spanish American Indians | 100.0 /100 | #10 | Exceptional 3.58 |
| Tohono O'odham | 100.0 /100 | #11 | Exceptional 3.53 |
| Immigrants | Mexico | 100.0 /100 | #12 | Exceptional 3.52 |
| Sioux | 100.0 /100 | #13 | Exceptional 3.52 |
| Immigrants | Central America | 100.0 /100 | #14 | Exceptional 3.49 |
| Tongans | 100.0 /100 | #15 | Exceptional 3.49 |