Delaware vs Slovak Male Disability
COMPARE
Delaware
Slovak
Male Disability
Male Disability Comparison
Delaware
Slovaks
13.5%
MALE DISABILITY
0.0/ 100
METRIC RATING
311th/ 347
METRIC RANK
12.7%
MALE DISABILITY
0.0/ 100
METRIC RATING
279th/ 347
METRIC RANK
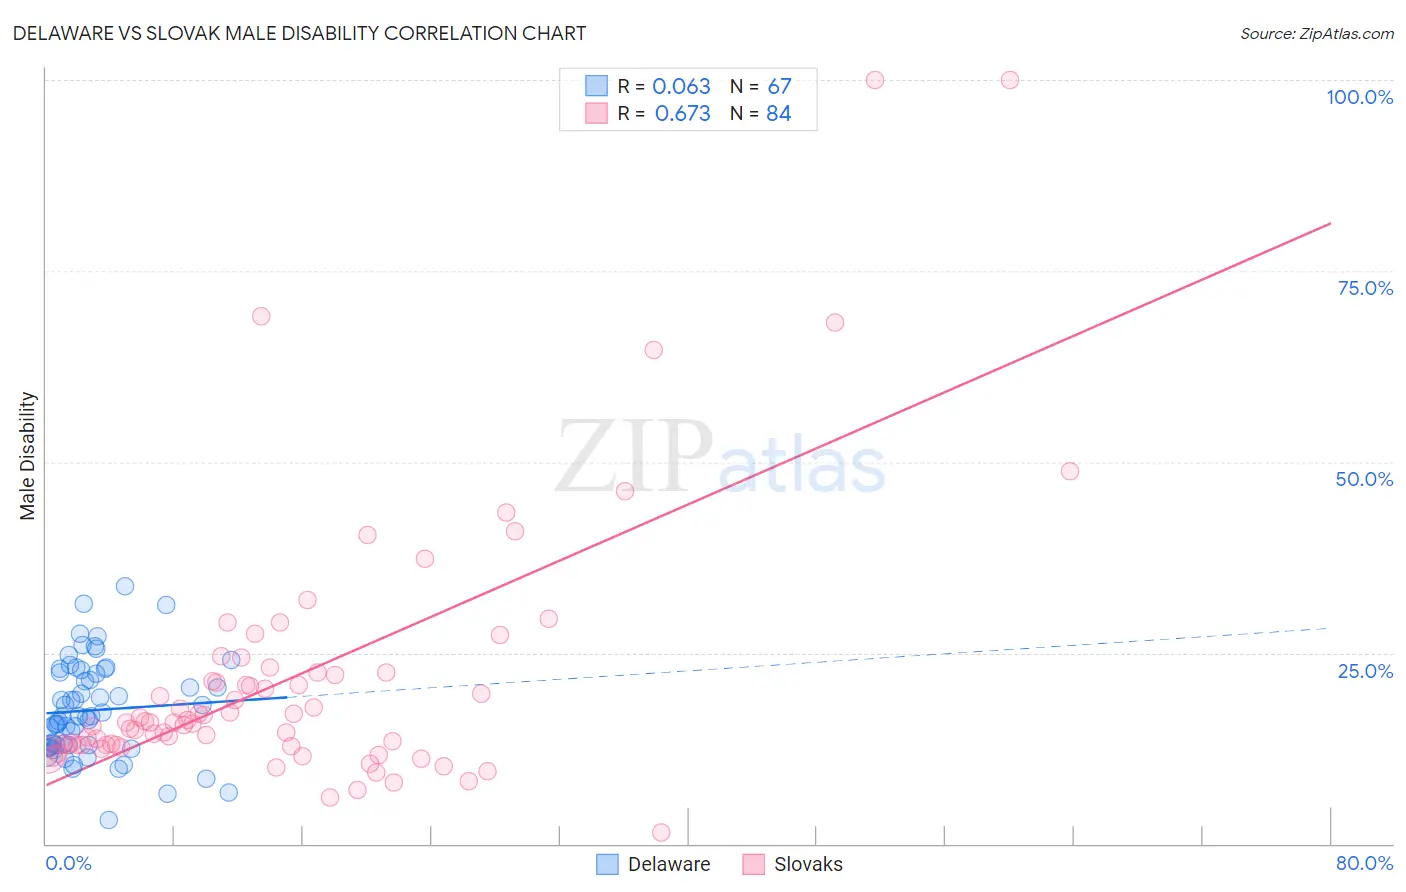
Delaware vs Slovak Male Disability Correlation Chart
The statistical analysis conducted on geographies consisting of 96,239,516 people shows a slight positive correlation between the proportion of Delaware and percentage of males with a disability in the United States with a correlation coefficient (R) of 0.063 and weighted average of 13.5%. Similarly, the statistical analysis conducted on geographies consisting of 397,843,649 people shows a significant positive correlation between the proportion of Slovaks and percentage of males with a disability in the United States with a correlation coefficient (R) of 0.673 and weighted average of 12.7%, a difference of 6.1%.
Male Disability Correlation Summary
| Measurement | Delaware | Slovak |
| Minimum | 3.1% | 1.5% |
| Maximum | 33.7% | 100.0% |
| Range | 30.6% | 98.5% |
| Mean | 17.5% | 21.9% |
| Median | 16.6% | 15.9% |
| Interquartile 25% (IQ1) | 12.7% | 12.9% |
| Interquartile 75% (IQ3) | 22.4% | 22.4% |
| Interquartile Range (IQR) | 9.7% | 9.5% |
| Standard Deviation (Sample) | 6.3% | 17.7% |
| Standard Deviation (Population) | 6.2% | 17.6% |
Similar Demographics by Male Disability
Demographics Similar to Delaware by Male Disability
In terms of male disability, the demographic groups most similar to Delaware are Immigrants from the Azores (13.4%, a difference of 0.19%), Blackfeet (13.4%, a difference of 0.33%), Yakama (13.5%, a difference of 0.55%), Puget Sound Salish (13.5%, a difference of 0.57%), and Aleut (13.5%, a difference of 0.63%).
| Demographics | Rating | Rank | Male Disability |
| Blacks/African Americans | 0.0 /100 | #304 | Tragic 13.2% |
| French Canadians | 0.0 /100 | #305 | Tragic 13.3% |
| Spanish Americans | 0.0 /100 | #306 | Tragic 13.3% |
| Arapaho | 0.0 /100 | #307 | Tragic 13.3% |
| French American Indians | 0.0 /100 | #308 | Tragic 13.4% |
| Blackfeet | 0.0 /100 | #309 | Tragic 13.4% |
| Immigrants | Azores | 0.0 /100 | #310 | Tragic 13.4% |
| Delaware | 0.0 /100 | #311 | Tragic 13.5% |
| Yakama | 0.0 /100 | #312 | Tragic 13.5% |
| Puget Sound Salish | 0.0 /100 | #313 | Tragic 13.5% |
| Aleuts | 0.0 /100 | #314 | Tragic 13.5% |
| Iroquois | 0.0 /100 | #315 | Tragic 13.6% |
| Alaska Natives | 0.0 /100 | #316 | Tragic 13.6% |
| Paiute | 0.0 /100 | #317 | Tragic 13.7% |
| Cree | 0.0 /100 | #318 | Tragic 13.7% |
Demographics Similar to Slovaks by Male Disability
In terms of male disability, the demographic groups most similar to Slovaks are Dutch (12.7%, a difference of 0.050%), Sioux (12.7%, a difference of 0.11%), Central American Indian (12.7%, a difference of 0.15%), Irish (12.7%, a difference of 0.16%), and German (12.7%, a difference of 0.17%).
| Demographics | Rating | Rank | Male Disability |
| Hmong | 0.0 /100 | #272 | Tragic 12.5% |
| Native Hawaiians | 0.0 /100 | #273 | Tragic 12.5% |
| Hopi | 0.0 /100 | #274 | Tragic 12.5% |
| Fijians | 0.0 /100 | #275 | Tragic 12.6% |
| Africans | 0.0 /100 | #276 | Tragic 12.6% |
| Finns | 0.0 /100 | #277 | Tragic 12.6% |
| Central American Indians | 0.0 /100 | #278 | Tragic 12.7% |
| Slovaks | 0.0 /100 | #279 | Tragic 12.7% |
| Dutch | 0.0 /100 | #280 | Tragic 12.7% |
| Sioux | 0.0 /100 | #281 | Tragic 12.7% |
| Irish | 0.0 /100 | #282 | Tragic 12.7% |
| Germans | 0.0 /100 | #283 | Tragic 12.7% |
| Spanish | 0.0 /100 | #284 | Tragic 12.7% |
| Welsh | 0.0 /100 | #285 | Tragic 12.7% |
| Scottish | 0.0 /100 | #286 | Tragic 12.8% |