Samoan vs Immigrants from Ghana Currently Married
COMPARE
Samoan
Immigrants from Ghana
Currently Married
Currently Married Comparison
Samoans
Immigrants from Ghana
46.8%
CURRENTLY MARRIED
59.8/ 100
METRIC RATING
165th/ 347
METRIC RANK
42.7%
CURRENTLY MARRIED
0.0/ 100
METRIC RATING
290th/ 347
METRIC RANK
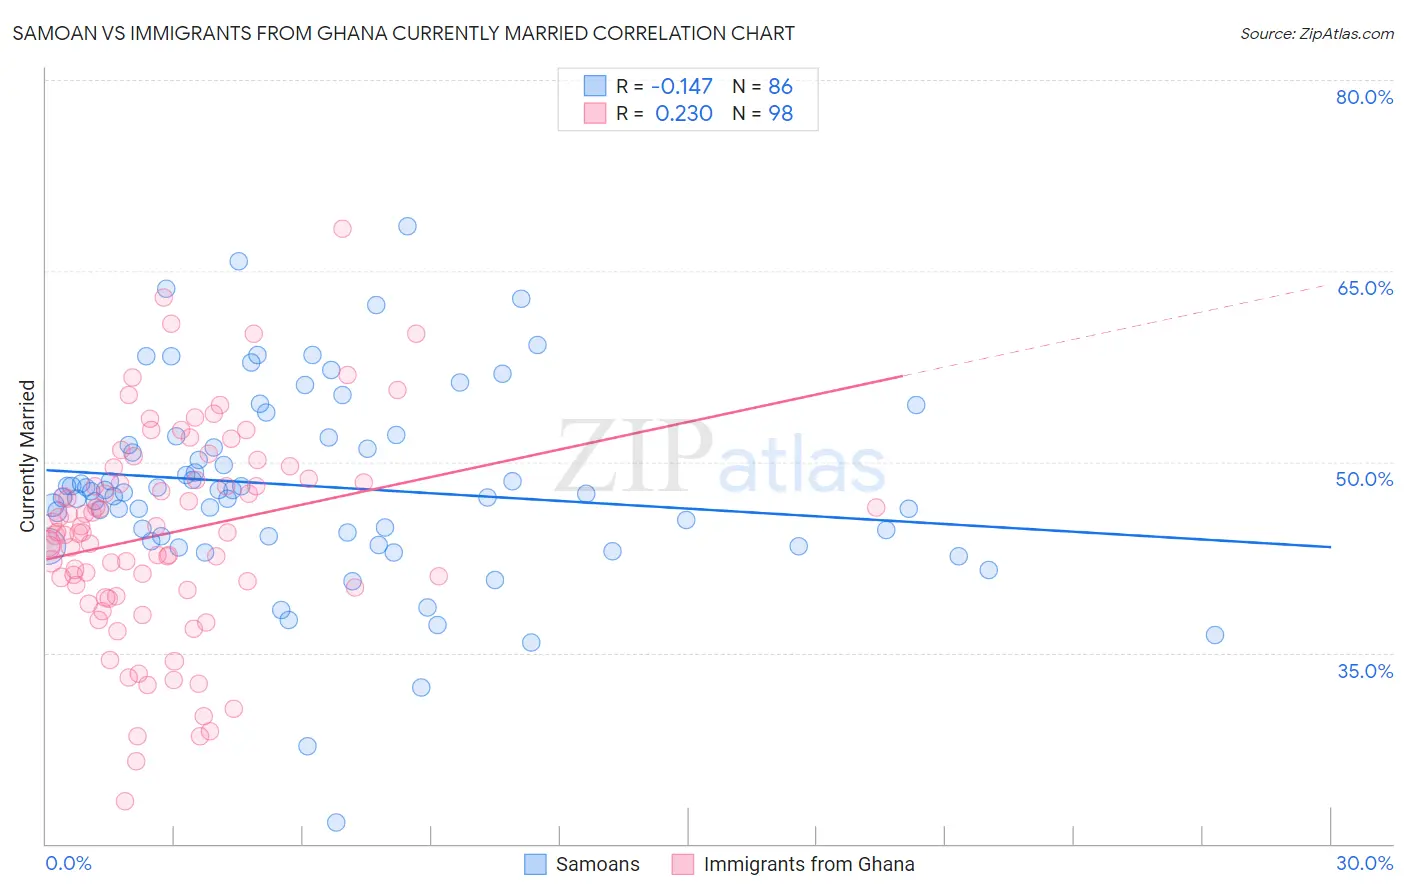
Samoan vs Immigrants from Ghana Currently Married Correlation Chart
The statistical analysis conducted on geographies consisting of 225,188,155 people shows a poor negative correlation between the proportion of Samoans and percentage of population currently married in the United States with a correlation coefficient (R) of -0.147 and weighted average of 46.8%. Similarly, the statistical analysis conducted on geographies consisting of 199,931,543 people shows a weak positive correlation between the proportion of Immigrants from Ghana and percentage of population currently married in the United States with a correlation coefficient (R) of 0.230 and weighted average of 42.7%, a difference of 9.6%.
Currently Married Correlation Summary
| Measurement | Samoan | Immigrants from Ghana |
| Minimum | 21.7% | 23.3% |
| Maximum | 68.5% | 68.3% |
| Range | 46.8% | 45.0% |
| Mean | 48.1% | 44.4% |
| Median | 47.6% | 44.5% |
| Interquartile 25% (IQ1) | 44.1% | 39.9% |
| Interquartile 75% (IQ3) | 51.9% | 48.7% |
| Interquartile Range (IQR) | 7.8% | 8.8% |
| Standard Deviation (Sample) | 7.8% | 8.3% |
| Standard Deviation (Population) | 7.7% | 8.2% |
Similar Demographics by Currently Married
Demographics Similar to Samoans by Currently Married
In terms of currently married, the demographic groups most similar to Samoans are Immigrants from Syria (46.8%, a difference of 0.020%), Spaniard (46.8%, a difference of 0.040%), Immigrants from Afghanistan (46.8%, a difference of 0.060%), Armenian (46.8%, a difference of 0.060%), and Immigrants from Latvia (46.7%, a difference of 0.11%).
| Demographics | Rating | Rank | Currently Married |
| Cherokee | 66.8 /100 | #158 | Good 46.9% |
| Iraqis | 66.4 /100 | #159 | Good 46.9% |
| Immigrants | Uzbekistan | 66.0 /100 | #160 | Good 46.9% |
| Immigrants | Southern Europe | 65.9 /100 | #161 | Good 46.9% |
| Immigrants | Nonimmigrants | 65.4 /100 | #162 | Good 46.9% |
| Delaware | 64.7 /100 | #163 | Good 46.9% |
| Immigrants | Western Asia | 64.2 /100 | #164 | Good 46.9% |
| Samoans | 59.8 /100 | #165 | Average 46.8% |
| Immigrants | Syria | 59.3 /100 | #166 | Average 46.8% |
| Spaniards | 58.8 /100 | #167 | Average 46.8% |
| Immigrants | Afghanistan | 58.2 /100 | #168 | Average 46.8% |
| Armenians | 58.2 /100 | #169 | Average 46.8% |
| Immigrants | Latvia | 56.7 /100 | #170 | Average 46.7% |
| Immigrants | Zimbabwe | 52.4 /100 | #171 | Average 46.7% |
| Aleuts | 52.0 /100 | #172 | Average 46.7% |
Demographics Similar to Immigrants from Ghana by Currently Married
In terms of currently married, the demographic groups most similar to Immigrants from Ghana are Paiute (42.7%, a difference of 0.010%), Immigrants from Guatemala (42.6%, a difference of 0.12%), Native/Alaskan (42.8%, a difference of 0.24%), Subsaharan African (42.6%, a difference of 0.27%), and Yuman (42.6%, a difference of 0.29%).
| Demographics | Rating | Rank | Currently Married |
| Kiowa | 0.0 /100 | #283 | Tragic 43.2% |
| Immigrants | El Salvador | 0.0 /100 | #284 | Tragic 43.1% |
| Immigrants | Middle Africa | 0.0 /100 | #285 | Tragic 43.0% |
| Ghanaians | 0.0 /100 | #286 | Tragic 42.9% |
| Guatemalans | 0.0 /100 | #287 | Tragic 42.9% |
| Natives/Alaskans | 0.0 /100 | #288 | Tragic 42.8% |
| Paiute | 0.0 /100 | #289 | Tragic 42.7% |
| Immigrants | Ghana | 0.0 /100 | #290 | Tragic 42.7% |
| Immigrants | Guatemala | 0.0 /100 | #291 | Tragic 42.6% |
| Sub-Saharan Africans | 0.0 /100 | #292 | Tragic 42.6% |
| Yuman | 0.0 /100 | #293 | Tragic 42.6% |
| Hondurans | 0.0 /100 | #294 | Tragic 42.5% |
| Immigrants | Western Africa | 0.0 /100 | #295 | Tragic 42.4% |
| Menominee | 0.0 /100 | #296 | Tragic 42.3% |
| Cheyenne | 0.0 /100 | #297 | Tragic 42.2% |