Crow vs Immigrants from Ghana Disability Age 65 to 74
COMPARE
Crow
Immigrants from Ghana
Disability Age 65 to 74
Disability Age 65 to 74 Comparison
Crow
Immigrants from Ghana
27.9%
DISABILITY AGE 65 TO 74
0.0/ 100
METRIC RATING
316th/ 347
METRIC RANK
24.5%
DISABILITY AGE 65 TO 74
3.0/ 100
METRIC RATING
238th/ 347
METRIC RANK
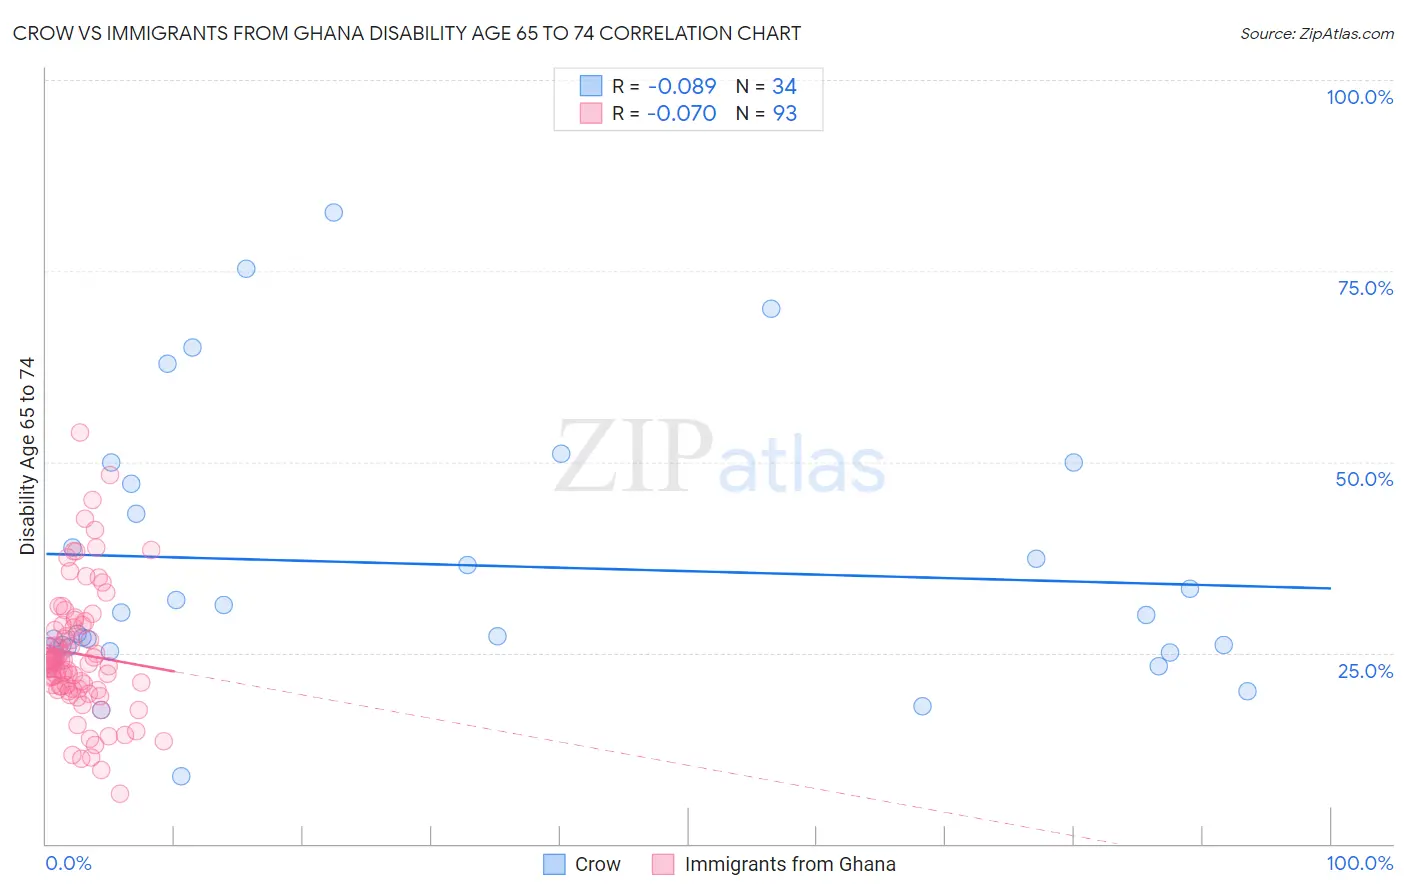
Crow vs Immigrants from Ghana Disability Age 65 to 74 Correlation Chart
The statistical analysis conducted on geographies consisting of 59,176,380 people shows a slight negative correlation between the proportion of Crow and percentage of population with a disability between the ages 65 and 75 in the United States with a correlation coefficient (R) of -0.089 and weighted average of 27.9%. Similarly, the statistical analysis conducted on geographies consisting of 199,556,575 people shows a slight negative correlation between the proportion of Immigrants from Ghana and percentage of population with a disability between the ages 65 and 75 in the United States with a correlation coefficient (R) of -0.070 and weighted average of 24.5%, a difference of 14.0%.
Disability Age 65 to 74 Correlation Summary
| Measurement | Crow | Immigrants from Ghana |
| Minimum | 8.8% | 6.5% |
| Maximum | 82.6% | 53.8% |
| Range | 73.8% | 47.4% |
| Mean | 36.5% | 24.8% |
| Median | 30.2% | 23.8% |
| Interquartile 25% (IQ1) | 25.8% | 20.3% |
| Interquartile 75% (IQ3) | 47.2% | 28.6% |
| Interquartile Range (IQR) | 21.4% | 8.3% |
| Standard Deviation (Sample) | 17.6% | 8.4% |
| Standard Deviation (Population) | 17.4% | 8.4% |
Similar Demographics by Disability Age 65 to 74
Demographics Similar to Crow by Disability Age 65 to 74
In terms of disability age 65 to 74, the demographic groups most similar to Crow are Cajun (27.9%, a difference of 0.040%), Immigrants from Armenia (28.0%, a difference of 0.090%), Nepalese (28.0%, a difference of 0.31%), Chippewa (27.8%, a difference of 0.52%), and Paiute (27.8%, a difference of 0.53%).
| Demographics | Rating | Rank | Disability Age 65 to 74 |
| Yaqui | 0.0 /100 | #309 | Tragic 27.4% |
| Shoshone | 0.0 /100 | #310 | Tragic 27.4% |
| Menominee | 0.0 /100 | #311 | Tragic 27.4% |
| Osage | 0.0 /100 | #312 | Tragic 27.5% |
| Paiute | 0.0 /100 | #313 | Tragic 27.8% |
| Chippewa | 0.0 /100 | #314 | Tragic 27.8% |
| Cajuns | 0.0 /100 | #315 | Tragic 27.9% |
| Crow | 0.0 /100 | #316 | Tragic 27.9% |
| Immigrants | Armenia | 0.0 /100 | #317 | Tragic 28.0% |
| Nepalese | 0.0 /100 | #318 | Tragic 28.0% |
| Arapaho | 0.0 /100 | #319 | Tragic 28.1% |
| Cherokee | 0.0 /100 | #320 | Tragic 28.2% |
| Comanche | 0.0 /100 | #321 | Tragic 28.3% |
| Aleuts | 0.0 /100 | #322 | Tragic 28.4% |
| Puerto Ricans | 0.0 /100 | #323 | Tragic 29.1% |
Demographics Similar to Immigrants from Ghana by Disability Age 65 to 74
In terms of disability age 65 to 74, the demographic groups most similar to Immigrants from Ghana are West Indian (24.5%, a difference of 0.17%), Immigrants from Caribbean (24.6%, a difference of 0.22%), German Russian (24.4%, a difference of 0.27%), Scotch-Irish (24.4%, a difference of 0.31%), and Spaniard (24.6%, a difference of 0.31%).
| Demographics | Rating | Rank | Disability Age 65 to 74 |
| Immigrants | Thailand | 5.2 /100 | #231 | Tragic 24.3% |
| Immigrants | Zaire | 5.0 /100 | #232 | Tragic 24.3% |
| Bahamians | 4.5 /100 | #233 | Tragic 24.4% |
| Panamanians | 4.2 /100 | #234 | Tragic 24.4% |
| Scotch-Irish | 3.8 /100 | #235 | Tragic 24.4% |
| German Russians | 3.7 /100 | #236 | Tragic 24.4% |
| West Indians | 3.4 /100 | #237 | Tragic 24.5% |
| Immigrants | Ghana | 3.0 /100 | #238 | Tragic 24.5% |
| Immigrants | Caribbean | 2.6 /100 | #239 | Tragic 24.6% |
| Spaniards | 2.4 /100 | #240 | Tragic 24.6% |
| Immigrants | Western Africa | 2.3 /100 | #241 | Tragic 24.6% |
| Immigrants | Senegal | 2.2 /100 | #242 | Tragic 24.6% |
| Spanish | 2.2 /100 | #243 | Tragic 24.6% |
| Armenians | 2.0 /100 | #244 | Tragic 24.7% |
| British West Indians | 2.0 /100 | #245 | Tragic 24.7% |