Choctaw vs Immigrants from Ghana Currently Married
COMPARE
Choctaw
Immigrants from Ghana
Currently Married
Currently Married Comparison
Choctaw
Immigrants from Ghana
46.3%
CURRENTLY MARRIED
29.1/ 100
METRIC RATING
190th/ 347
METRIC RANK
42.7%
CURRENTLY MARRIED
0.0/ 100
METRIC RATING
290th/ 347
METRIC RANK
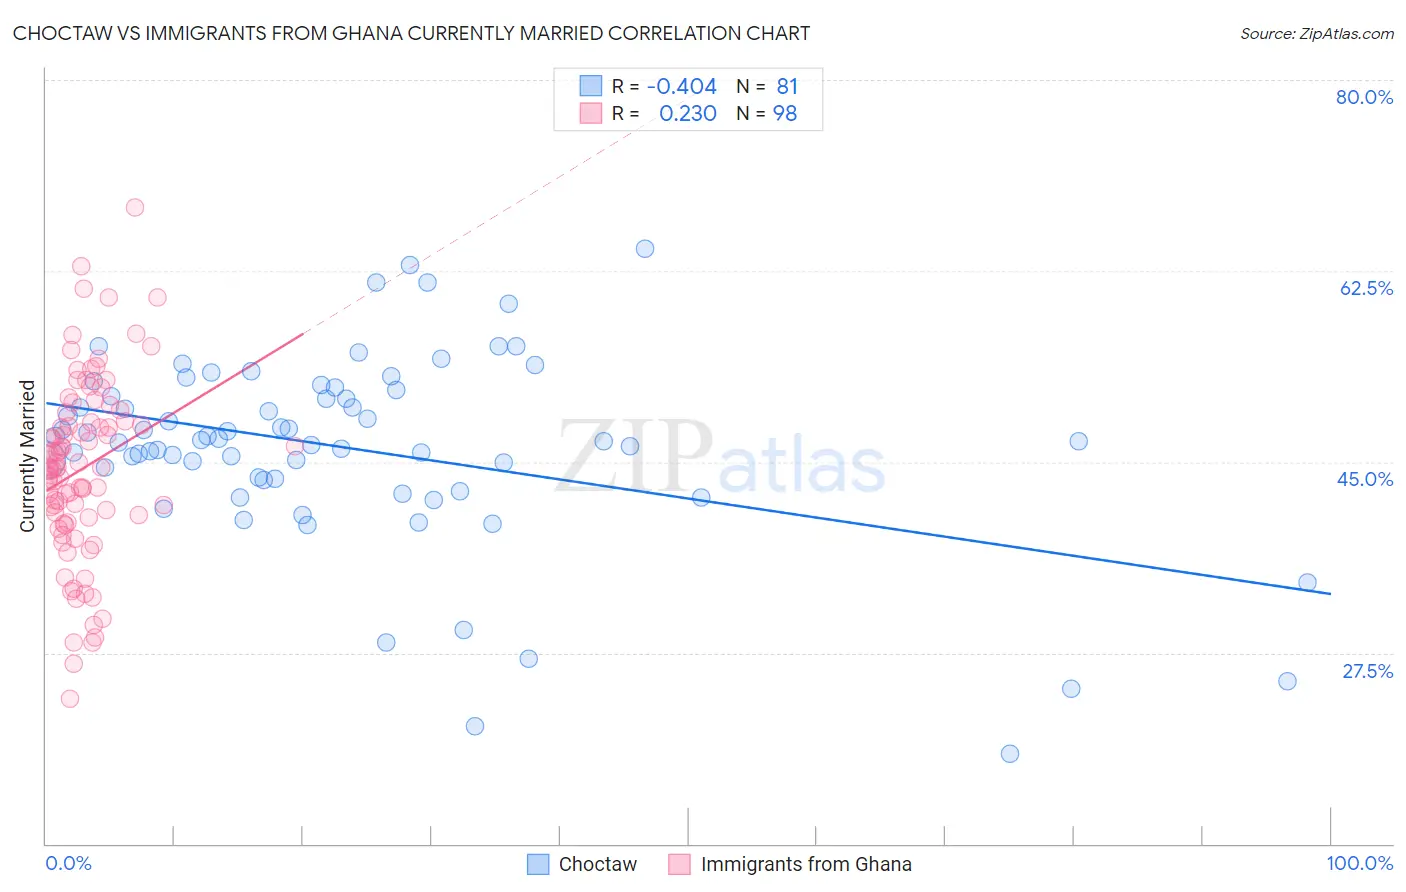
Choctaw vs Immigrants from Ghana Currently Married Correlation Chart
The statistical analysis conducted on geographies consisting of 269,717,873 people shows a moderate negative correlation between the proportion of Choctaw and percentage of population currently married in the United States with a correlation coefficient (R) of -0.404 and weighted average of 46.3%. Similarly, the statistical analysis conducted on geographies consisting of 199,931,543 people shows a weak positive correlation between the proportion of Immigrants from Ghana and percentage of population currently married in the United States with a correlation coefficient (R) of 0.230 and weighted average of 42.7%, a difference of 8.3%.
Currently Married Correlation Summary
| Measurement | Choctaw | Immigrants from Ghana |
| Minimum | 18.2% | 23.3% |
| Maximum | 64.5% | 68.3% |
| Range | 46.3% | 45.0% |
| Mean | 46.2% | 44.4% |
| Median | 46.9% | 44.5% |
| Interquartile 25% (IQ1) | 43.4% | 39.9% |
| Interquartile 75% (IQ3) | 51.3% | 48.7% |
| Interquartile Range (IQR) | 7.9% | 8.8% |
| Standard Deviation (Sample) | 8.8% | 8.3% |
| Standard Deviation (Population) | 8.7% | 8.2% |
Similar Demographics by Currently Married
Demographics Similar to Choctaw by Currently Married
In terms of currently married, the demographic groups most similar to Choctaw are Fijian (46.3%, a difference of 0.050%), Immigrants from France (46.2%, a difference of 0.060%), Colombian (46.3%, a difference of 0.12%), Soviet Union (46.2%, a difference of 0.16%), and Immigrants from Fiji (46.2%, a difference of 0.19%).
| Demographics | Rating | Rank | Currently Married |
| Immigrants | Northern Africa | 39.7 /100 | #183 | Fair 46.5% |
| Brazilians | 39.3 /100 | #184 | Fair 46.4% |
| Mongolians | 37.6 /100 | #185 | Fair 46.4% |
| Immigrants | Chile | 36.8 /100 | #186 | Fair 46.4% |
| Immigrants | Peru | 35.3 /100 | #187 | Fair 46.4% |
| Colombians | 31.8 /100 | #188 | Fair 46.3% |
| Fijians | 30.3 /100 | #189 | Fair 46.3% |
| Choctaw | 29.1 /100 | #190 | Fair 46.3% |
| Immigrants | France | 27.7 /100 | #191 | Fair 46.2% |
| Soviet Union | 25.7 /100 | #192 | Fair 46.2% |
| Immigrants | Fiji | 25.0 /100 | #193 | Fair 46.2% |
| South Americans | 23.8 /100 | #194 | Fair 46.1% |
| Immigrants | Nepal | 23.7 /100 | #195 | Fair 46.1% |
| Immigrants | Bosnia and Herzegovina | 22.2 /100 | #196 | Fair 46.1% |
| Immigrants | Kuwait | 21.7 /100 | #197 | Fair 46.1% |
Demographics Similar to Immigrants from Ghana by Currently Married
In terms of currently married, the demographic groups most similar to Immigrants from Ghana are Paiute (42.7%, a difference of 0.010%), Immigrants from Guatemala (42.6%, a difference of 0.12%), Native/Alaskan (42.8%, a difference of 0.24%), Subsaharan African (42.6%, a difference of 0.27%), and Yuman (42.6%, a difference of 0.29%).
| Demographics | Rating | Rank | Currently Married |
| Kiowa | 0.0 /100 | #283 | Tragic 43.2% |
| Immigrants | El Salvador | 0.0 /100 | #284 | Tragic 43.1% |
| Immigrants | Middle Africa | 0.0 /100 | #285 | Tragic 43.0% |
| Ghanaians | 0.0 /100 | #286 | Tragic 42.9% |
| Guatemalans | 0.0 /100 | #287 | Tragic 42.9% |
| Natives/Alaskans | 0.0 /100 | #288 | Tragic 42.8% |
| Paiute | 0.0 /100 | #289 | Tragic 42.7% |
| Immigrants | Ghana | 0.0 /100 | #290 | Tragic 42.7% |
| Immigrants | Guatemala | 0.0 /100 | #291 | Tragic 42.6% |
| Sub-Saharan Africans | 0.0 /100 | #292 | Tragic 42.6% |
| Yuman | 0.0 /100 | #293 | Tragic 42.6% |
| Hondurans | 0.0 /100 | #294 | Tragic 42.5% |
| Immigrants | Western Africa | 0.0 /100 | #295 | Tragic 42.4% |
| Menominee | 0.0 /100 | #296 | Tragic 42.3% |
| Cheyenne | 0.0 /100 | #297 | Tragic 42.2% |