Immigrants from Sri Lanka vs Immigrants from Ghana Currently Married
COMPARE
Immigrants from Sri Lanka
Immigrants from Ghana
Currently Married
Currently Married Comparison
Immigrants from Sri Lanka
Immigrants from Ghana
48.1%
CURRENTLY MARRIED
96.9/ 100
METRIC RATING
81st/ 347
METRIC RANK
42.7%
CURRENTLY MARRIED
0.0/ 100
METRIC RATING
290th/ 347
METRIC RANK
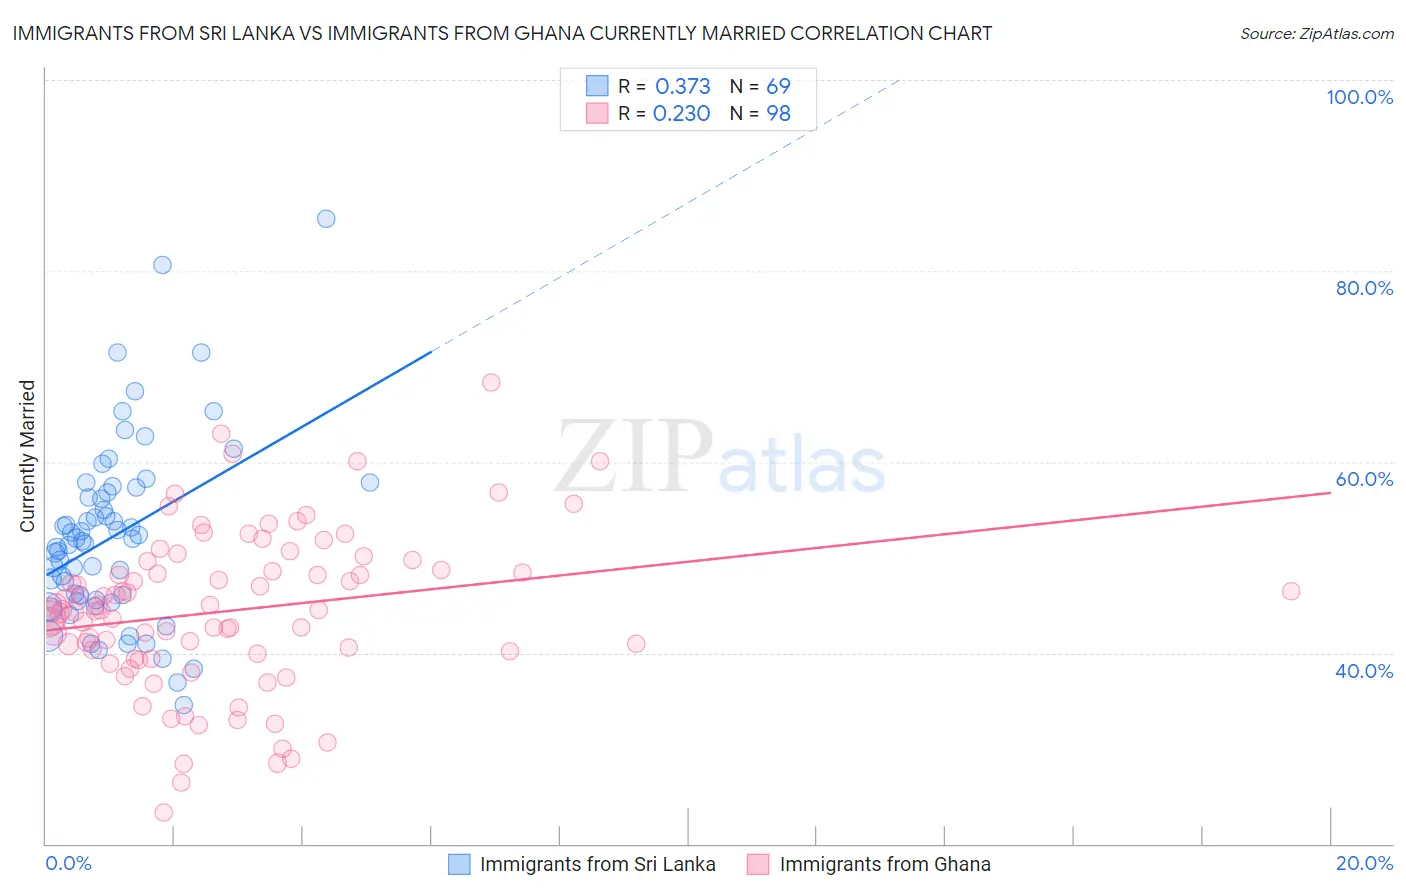
Immigrants from Sri Lanka vs Immigrants from Ghana Currently Married Correlation Chart
The statistical analysis conducted on geographies consisting of 149,691,933 people shows a mild positive correlation between the proportion of Immigrants from Sri Lanka and percentage of population currently married in the United States with a correlation coefficient (R) of 0.373 and weighted average of 48.1%. Similarly, the statistical analysis conducted on geographies consisting of 199,931,543 people shows a weak positive correlation between the proportion of Immigrants from Ghana and percentage of population currently married in the United States with a correlation coefficient (R) of 0.230 and weighted average of 42.7%, a difference of 12.7%.
Currently Married Correlation Summary
| Measurement | Immigrants from Sri Lanka | Immigrants from Ghana |
| Minimum | 34.5% | 23.3% |
| Maximum | 85.5% | 68.3% |
| Range | 51.0% | 45.0% |
| Mean | 52.2% | 44.4% |
| Median | 51.7% | 44.5% |
| Interquartile 25% (IQ1) | 45.5% | 39.9% |
| Interquartile 75% (IQ3) | 57.1% | 48.7% |
| Interquartile Range (IQR) | 11.6% | 8.8% |
| Standard Deviation (Sample) | 9.6% | 8.3% |
| Standard Deviation (Population) | 9.5% | 8.2% |
Similar Demographics by Currently Married
Demographics Similar to Immigrants from Sri Lanka by Currently Married
In terms of currently married, the demographic groups most similar to Immigrants from Sri Lanka are Immigrants from Europe (48.1%, a difference of 0.0%), Immigrants from Poland (48.1%, a difference of 0.010%), Bolivian (48.1%, a difference of 0.010%), Immigrants from Israel (48.1%, a difference of 0.010%), and Immigrants from South Africa (48.1%, a difference of 0.040%).
| Demographics | Rating | Rank | Currently Married |
| Estonians | 97.4 /100 | #74 | Exceptional 48.2% |
| Immigrants | Belarus | 97.2 /100 | #75 | Exceptional 48.1% |
| Basques | 97.2 /100 | #76 | Exceptional 48.1% |
| Slovenes | 97.1 /100 | #77 | Exceptional 48.1% |
| Immigrants | Belgium | 97.1 /100 | #78 | Exceptional 48.1% |
| Immigrants | South Africa | 97.0 /100 | #79 | Exceptional 48.1% |
| Immigrants | Poland | 96.9 /100 | #80 | Exceptional 48.1% |
| Immigrants | Sri Lanka | 96.9 /100 | #81 | Exceptional 48.1% |
| Immigrants | Europe | 96.9 /100 | #82 | Exceptional 48.1% |
| Bolivians | 96.9 /100 | #83 | Exceptional 48.1% |
| Immigrants | Israel | 96.9 /100 | #84 | Exceptional 48.1% |
| French Canadians | 96.3 /100 | #85 | Exceptional 48.0% |
| Immigrants | Japan | 96.2 /100 | #86 | Exceptional 48.0% |
| Jordanians | 96.2 /100 | #87 | Exceptional 48.0% |
| Immigrants | Eastern Europe | 96.1 /100 | #88 | Exceptional 48.0% |
Demographics Similar to Immigrants from Ghana by Currently Married
In terms of currently married, the demographic groups most similar to Immigrants from Ghana are Paiute (42.7%, a difference of 0.010%), Immigrants from Guatemala (42.6%, a difference of 0.12%), Native/Alaskan (42.8%, a difference of 0.24%), Subsaharan African (42.6%, a difference of 0.27%), and Yuman (42.6%, a difference of 0.29%).
| Demographics | Rating | Rank | Currently Married |
| Kiowa | 0.0 /100 | #283 | Tragic 43.2% |
| Immigrants | El Salvador | 0.0 /100 | #284 | Tragic 43.1% |
| Immigrants | Middle Africa | 0.0 /100 | #285 | Tragic 43.0% |
| Ghanaians | 0.0 /100 | #286 | Tragic 42.9% |
| Guatemalans | 0.0 /100 | #287 | Tragic 42.9% |
| Natives/Alaskans | 0.0 /100 | #288 | Tragic 42.8% |
| Paiute | 0.0 /100 | #289 | Tragic 42.7% |
| Immigrants | Ghana | 0.0 /100 | #290 | Tragic 42.7% |
| Immigrants | Guatemala | 0.0 /100 | #291 | Tragic 42.6% |
| Sub-Saharan Africans | 0.0 /100 | #292 | Tragic 42.6% |
| Yuman | 0.0 /100 | #293 | Tragic 42.6% |
| Hondurans | 0.0 /100 | #294 | Tragic 42.5% |
| Immigrants | Western Africa | 0.0 /100 | #295 | Tragic 42.4% |
| Menominee | 0.0 /100 | #296 | Tragic 42.3% |
| Cheyenne | 0.0 /100 | #297 | Tragic 42.2% |