Crow vs Immigrants from Ghana Disability
COMPARE
Crow
Immigrants from Ghana
Disability
Disability Comparison
Crow
Immigrants from Ghana
12.9%
DISABILITY
0.0/ 100
METRIC RATING
285th/ 347
METRIC RANK
11.6%
DISABILITY
71.2/ 100
METRIC RATING
153rd/ 347
METRIC RANK
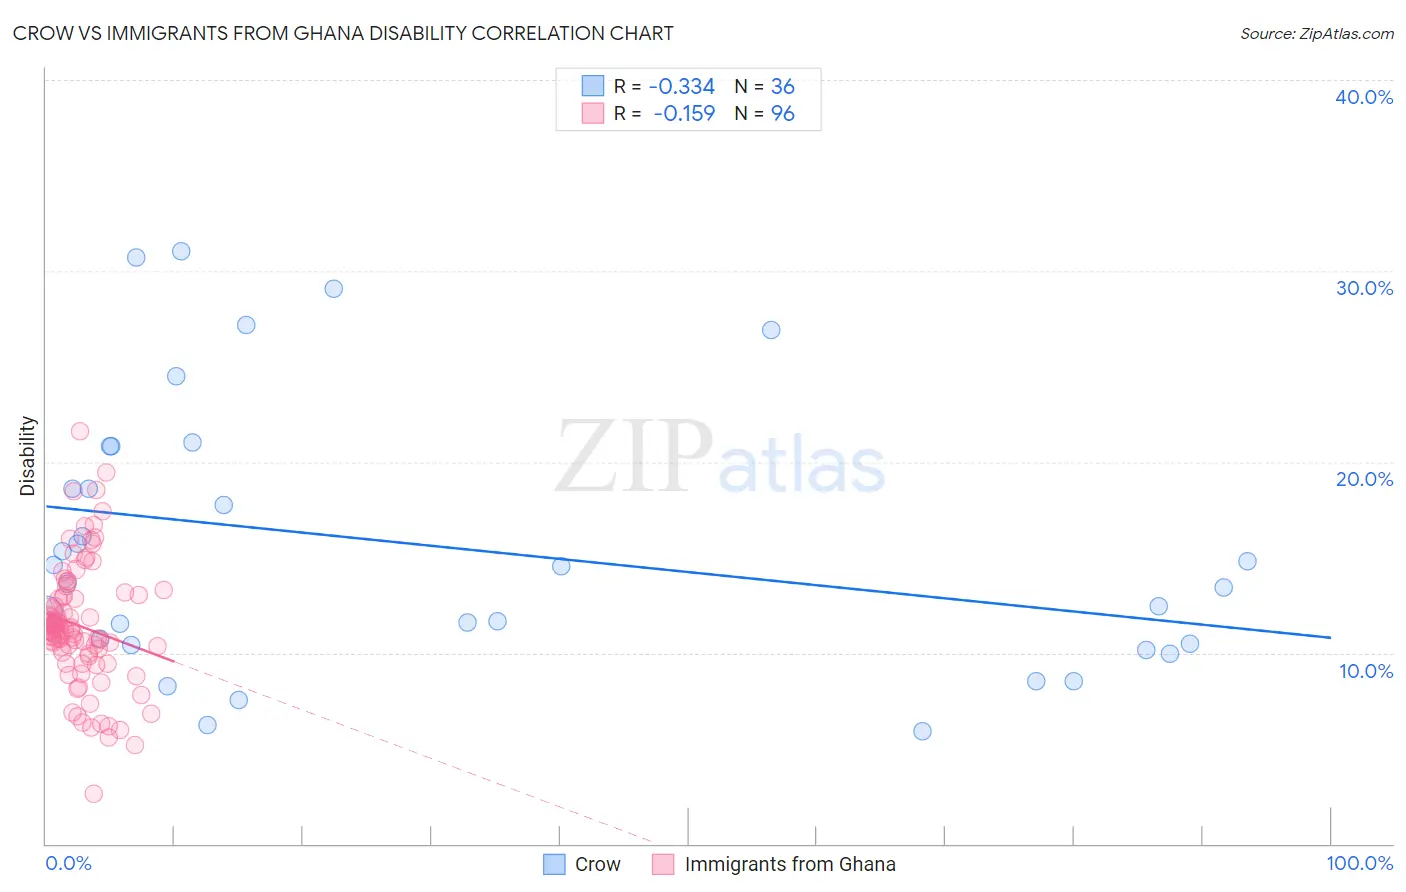
Crow vs Immigrants from Ghana Disability Correlation Chart
The statistical analysis conducted on geographies consisting of 59,204,631 people shows a mild negative correlation between the proportion of Crow and percentage of population with a disability in the United States with a correlation coefficient (R) of -0.334 and weighted average of 12.9%. Similarly, the statistical analysis conducted on geographies consisting of 199,930,208 people shows a poor negative correlation between the proportion of Immigrants from Ghana and percentage of population with a disability in the United States with a correlation coefficient (R) of -0.159 and weighted average of 11.6%, a difference of 11.4%.
Disability Correlation Summary
| Measurement | Crow | Immigrants from Ghana |
| Minimum | 5.9% | 2.6% |
| Maximum | 31.1% | 21.6% |
| Range | 25.1% | 19.0% |
| Mean | 15.6% | 11.4% |
| Median | 14.1% | 11.2% |
| Interquartile 25% (IQ1) | 10.4% | 9.9% |
| Interquartile 75% (IQ3) | 19.7% | 13.0% |
| Interquartile Range (IQR) | 9.3% | 3.1% |
| Standard Deviation (Sample) | 7.0% | 3.3% |
| Standard Deviation (Population) | 6.9% | 3.3% |
Similar Demographics by Disability
Demographics Similar to Crow by Disability
In terms of disability, the demographic groups most similar to Crow are Welsh (12.9%, a difference of 0.010%), Irish (12.9%, a difference of 0.20%), Scottish (12.9%, a difference of 0.22%), Immigrants from Portugal (12.9%, a difference of 0.36%), and English (13.0%, a difference of 0.38%).
| Demographics | Rating | Rank | Disability |
| Germans | 0.0 /100 | #278 | Tragic 12.8% |
| Fijians | 0.0 /100 | #279 | Tragic 12.8% |
| Spanish | 0.0 /100 | #280 | Tragic 12.8% |
| Immigrants | Portugal | 0.0 /100 | #281 | Tragic 12.9% |
| Scottish | 0.0 /100 | #282 | Tragic 12.9% |
| Irish | 0.0 /100 | #283 | Tragic 12.9% |
| Welsh | 0.0 /100 | #284 | Tragic 12.9% |
| Crow | 0.0 /100 | #285 | Tragic 12.9% |
| English | 0.0 /100 | #286 | Tragic 13.0% |
| Africans | 0.0 /100 | #287 | Tragic 13.0% |
| Whites/Caucasians | 0.0 /100 | #288 | Tragic 13.0% |
| Slovaks | 0.0 /100 | #289 | Tragic 13.0% |
| Cheyenne | 0.0 /100 | #290 | Tragic 13.0% |
| Yaqui | 0.0 /100 | #291 | Tragic 13.1% |
| Aleuts | 0.0 /100 | #292 | Tragic 13.1% |
Demographics Similar to Immigrants from Ghana by Disability
In terms of disability, the demographic groups most similar to Immigrants from Ghana are Immigrants from Guatemala (11.6%, a difference of 0.0%), Immigrants from Kenya (11.6%, a difference of 0.050%), Immigrants from Moldova (11.6%, a difference of 0.050%), Romanian (11.6%, a difference of 0.080%), and Immigrants from Netherlands (11.6%, a difference of 0.080%).
| Demographics | Rating | Rank | Disability |
| Immigrants | Hungary | 79.0 /100 | #146 | Good 11.5% |
| Immigrants | Ukraine | 77.6 /100 | #147 | Good 11.5% |
| Sudanese | 77.1 /100 | #148 | Good 11.5% |
| Immigrants | Norway | 73.2 /100 | #149 | Good 11.6% |
| Romanians | 72.7 /100 | #150 | Good 11.6% |
| Immigrants | Kenya | 72.1 /100 | #151 | Good 11.6% |
| Immigrants | Moldova | 72.0 /100 | #152 | Good 11.6% |
| Immigrants | Ghana | 71.2 /100 | #153 | Good 11.6% |
| Immigrants | Guatemala | 71.1 /100 | #154 | Good 11.6% |
| Immigrants | Netherlands | 69.8 /100 | #155 | Good 11.6% |
| Immigrants | Fiji | 69.5 /100 | #156 | Good 11.6% |
| Immigrants | Middle Africa | 69.5 /100 | #157 | Good 11.6% |
| Armenians | 65.9 /100 | #158 | Good 11.6% |
| Guatemalans | 65.1 /100 | #159 | Good 11.6% |
| Immigrants | Barbados | 64.2 /100 | #160 | Good 11.6% |