Creek vs Immigrants from Sudan Married-couple Households
COMPARE
Creek
Immigrants from Sudan
Married-couple Households
Married-couple Households Comparison
Creek
Immigrants from Sudan
45.3%
MARRIED-COUPLE HOUSEHOLDS
6.4/ 100
METRIC RATING
212th/ 347
METRIC RANK
41.9%
MARRIED-COUPLE HOUSEHOLDS
0.0/ 100
METRIC RATING
296th/ 347
METRIC RANK
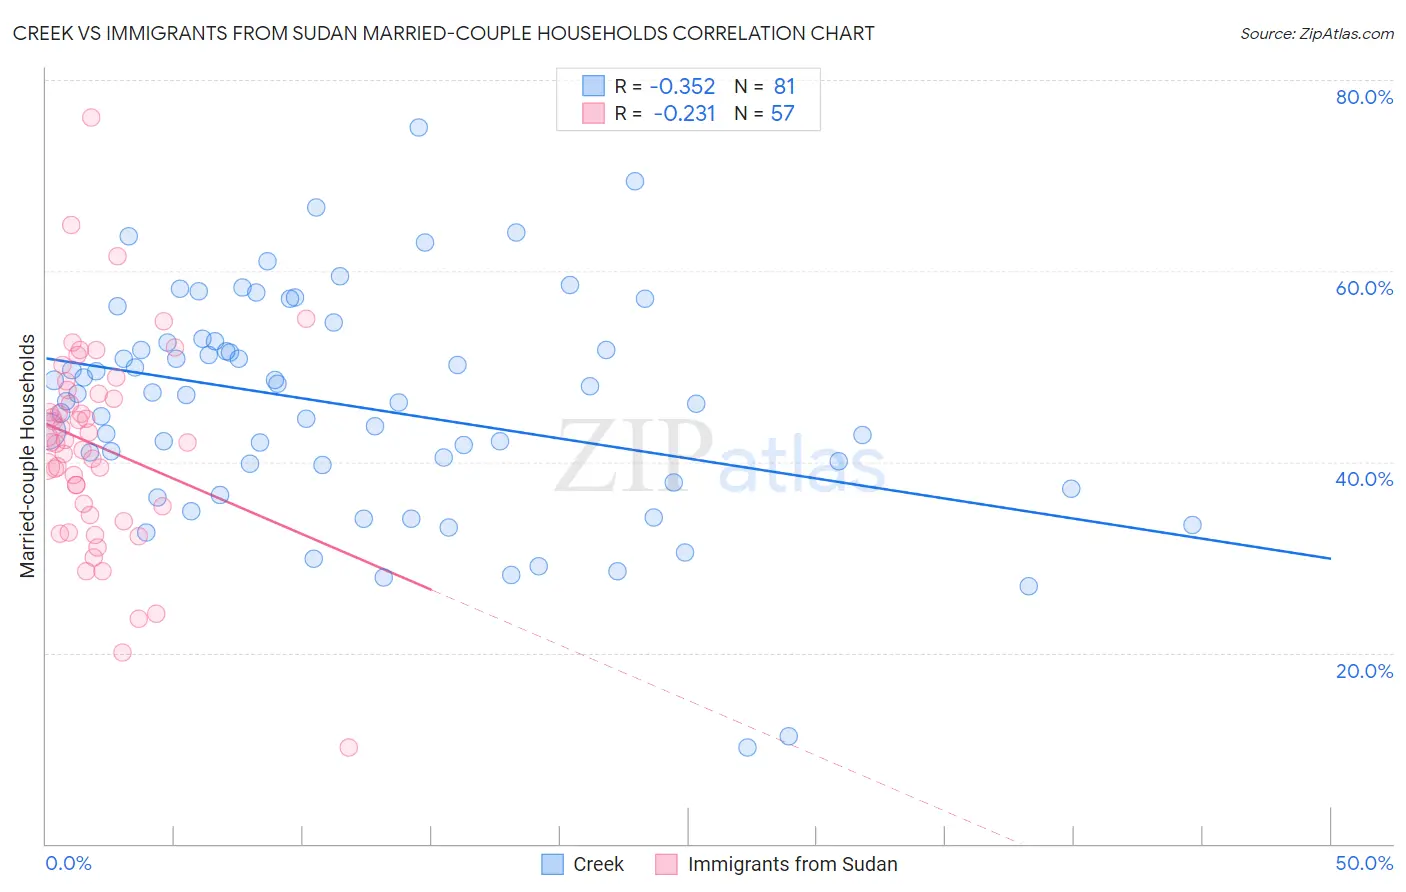
Creek vs Immigrants from Sudan Married-couple Households Correlation Chart
The statistical analysis conducted on geographies consisting of 178,433,601 people shows a mild negative correlation between the proportion of Creek and percentage of married-couple family households in the United States with a correlation coefficient (R) of -0.352 and weighted average of 45.3%. Similarly, the statistical analysis conducted on geographies consisting of 118,946,439 people shows a weak negative correlation between the proportion of Immigrants from Sudan and percentage of married-couple family households in the United States with a correlation coefficient (R) of -0.231 and weighted average of 41.9%, a difference of 8.0%.
Married-couple Households Correlation Summary
| Measurement | Creek | Immigrants from Sudan |
| Minimum | 10.1% | 10.0% |
| Maximum | 75.0% | 76.0% |
| Range | 64.9% | 66.0% |
| Mean | 45.8% | 41.7% |
| Median | 47.0% | 42.1% |
| Interquartile 25% (IQ1) | 38.8% | 34.9% |
| Interquartile 75% (IQ3) | 52.6% | 47.3% |
| Interquartile Range (IQR) | 13.9% | 12.4% |
| Standard Deviation (Sample) | 11.8% | 10.9% |
| Standard Deviation (Population) | 11.7% | 10.8% |
Similar Demographics by Married-couple Households
Demographics Similar to Creek by Married-couple Households
In terms of married-couple households, the demographic groups most similar to Creek are Yakama (45.2%, a difference of 0.10%), Immigrants from Spain (45.3%, a difference of 0.13%), Japanese (45.2%, a difference of 0.13%), Immigrants from Nepal (45.2%, a difference of 0.15%), and Immigrants from Portugal (45.2%, a difference of 0.15%).
| Demographics | Rating | Rank | Married-couple Households |
| Nepalese | 11.9 /100 | #205 | Poor 45.6% |
| Uruguayans | 10.4 /100 | #206 | Poor 45.5% |
| Immigrants | France | 8.8 /100 | #207 | Tragic 45.4% |
| Hispanics or Latinos | 8.7 /100 | #208 | Tragic 45.4% |
| Immigrants | Uzbekistan | 8.4 /100 | #209 | Tragic 45.4% |
| Cubans | 7.7 /100 | #210 | Tragic 45.4% |
| Immigrants | Spain | 7.3 /100 | #211 | Tragic 45.3% |
| Creek | 6.4 /100 | #212 | Tragic 45.3% |
| Yakama | 5.8 /100 | #213 | Tragic 45.2% |
| Japanese | 5.7 /100 | #214 | Tragic 45.2% |
| Immigrants | Nepal | 5.6 /100 | #215 | Tragic 45.2% |
| Immigrants | Portugal | 5.6 /100 | #216 | Tragic 45.2% |
| Panamanians | 5.5 /100 | #217 | Tragic 45.2% |
| Immigrants | Azores | 5.3 /100 | #218 | Tragic 45.2% |
| Nicaraguans | 5.3 /100 | #219 | Tragic 45.2% |
Demographics Similar to Immigrants from Sudan by Married-couple Households
In terms of married-couple households, the demographic groups most similar to Immigrants from Sudan are Menominee (42.0%, a difference of 0.11%), Immigrants from Yemen (42.0%, a difference of 0.11%), Kiowa (42.0%, a difference of 0.11%), Indonesian (42.0%, a difference of 0.22%), and Paiute (42.1%, a difference of 0.27%).
| Demographics | Rating | Rank | Married-couple Households |
| Sudanese | 0.0 /100 | #289 | Tragic 42.1% |
| Hondurans | 0.0 /100 | #290 | Tragic 42.1% |
| Paiute | 0.0 /100 | #291 | Tragic 42.1% |
| Indonesians | 0.0 /100 | #292 | Tragic 42.0% |
| Menominee | 0.0 /100 | #293 | Tragic 42.0% |
| Immigrants | Yemen | 0.0 /100 | #294 | Tragic 42.0% |
| Kiowa | 0.0 /100 | #295 | Tragic 42.0% |
| Immigrants | Sudan | 0.0 /100 | #296 | Tragic 41.9% |
| Arapaho | 0.0 /100 | #297 | Tragic 41.8% |
| Immigrants | Middle Africa | 0.0 /100 | #298 | Tragic 41.8% |
| Immigrants | Ghana | 0.0 /100 | #299 | Tragic 41.8% |
| Immigrants | Belize | 0.0 /100 | #300 | Tragic 41.8% |
| Immigrants | Bahamas | 0.0 /100 | #301 | Tragic 41.7% |
| Immigrants | Honduras | 0.0 /100 | #302 | Tragic 41.6% |
| Sub-Saharan Africans | 0.0 /100 | #303 | Tragic 41.6% |