Creek vs Immigrants from Venezuela Married-couple Households
COMPARE
Creek
Immigrants from Venezuela
Married-couple Households
Married-couple Households Comparison
Creek
Immigrants from Venezuela
45.3%
MARRIED-COUPLE HOUSEHOLDS
6.4/ 100
METRIC RATING
212th/ 347
METRIC RANK
47.4%
MARRIED-COUPLE HOUSEHOLDS
89.3/ 100
METRIC RATING
123rd/ 347
METRIC RANK
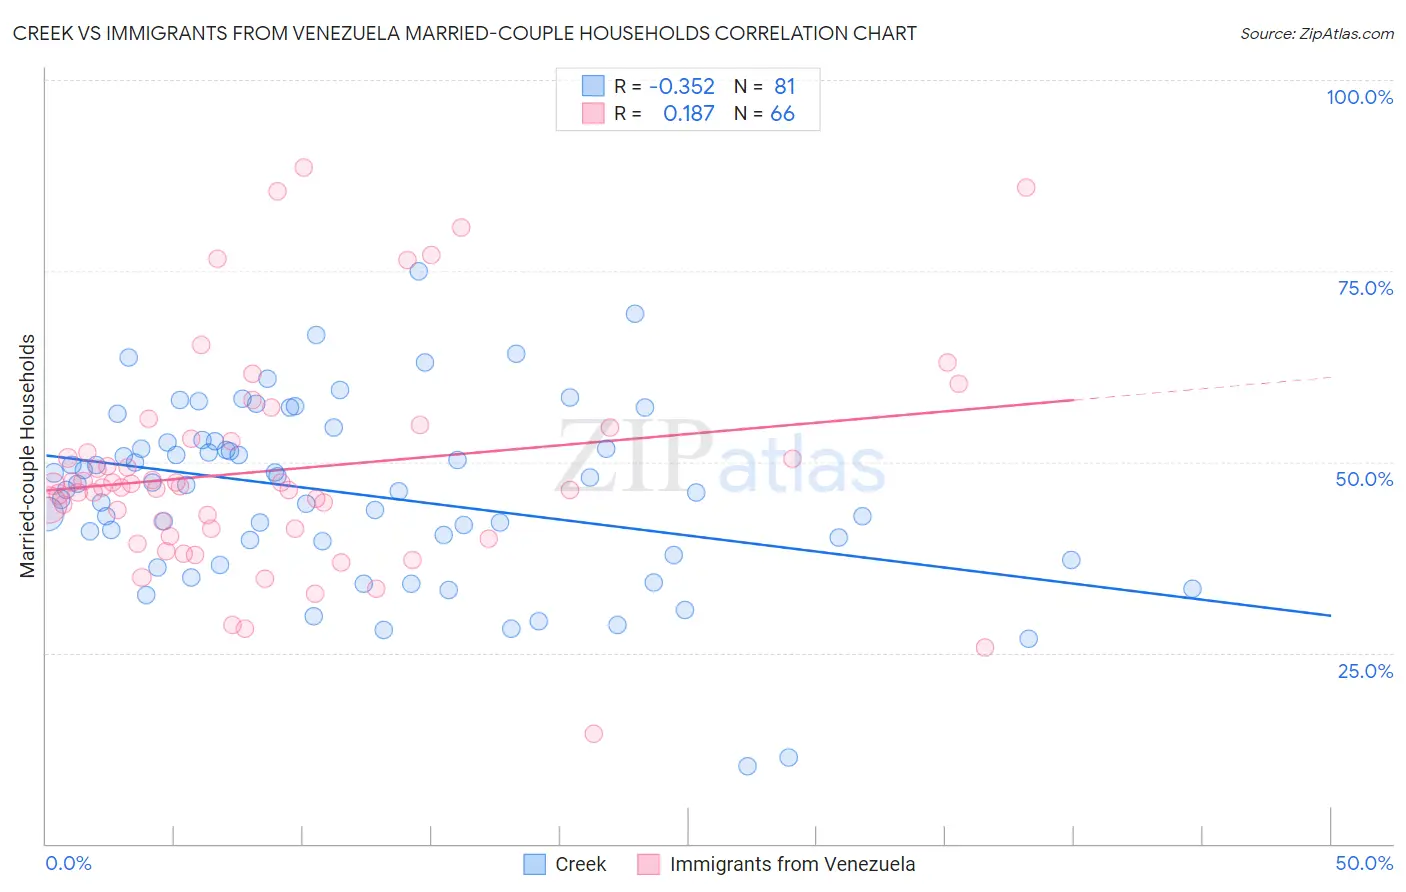
Creek vs Immigrants from Venezuela Married-couple Households Correlation Chart
The statistical analysis conducted on geographies consisting of 178,433,601 people shows a mild negative correlation between the proportion of Creek and percentage of married-couple family households in the United States with a correlation coefficient (R) of -0.352 and weighted average of 45.3%. Similarly, the statistical analysis conducted on geographies consisting of 287,780,225 people shows a poor positive correlation between the proportion of Immigrants from Venezuela and percentage of married-couple family households in the United States with a correlation coefficient (R) of 0.187 and weighted average of 47.4%, a difference of 4.6%.
Married-couple Households Correlation Summary
| Measurement | Creek | Immigrants from Venezuela |
| Minimum | 10.1% | 14.4% |
| Maximum | 75.0% | 88.5% |
| Range | 64.9% | 74.1% |
| Mean | 45.8% | 49.0% |
| Median | 47.0% | 46.8% |
| Interquartile 25% (IQ1) | 38.8% | 41.2% |
| Interquartile 75% (IQ3) | 52.6% | 53.1% |
| Interquartile Range (IQR) | 13.9% | 11.9% |
| Standard Deviation (Sample) | 11.8% | 14.4% |
| Standard Deviation (Population) | 11.7% | 14.2% |
Similar Demographics by Married-couple Households
Demographics Similar to Creek by Married-couple Households
In terms of married-couple households, the demographic groups most similar to Creek are Yakama (45.2%, a difference of 0.10%), Immigrants from Spain (45.3%, a difference of 0.13%), Japanese (45.2%, a difference of 0.13%), Immigrants from Nepal (45.2%, a difference of 0.15%), and Immigrants from Portugal (45.2%, a difference of 0.15%).
| Demographics | Rating | Rank | Married-couple Households |
| Nepalese | 11.9 /100 | #205 | Poor 45.6% |
| Uruguayans | 10.4 /100 | #206 | Poor 45.5% |
| Immigrants | France | 8.8 /100 | #207 | Tragic 45.4% |
| Hispanics or Latinos | 8.7 /100 | #208 | Tragic 45.4% |
| Immigrants | Uzbekistan | 8.4 /100 | #209 | Tragic 45.4% |
| Cubans | 7.7 /100 | #210 | Tragic 45.4% |
| Immigrants | Spain | 7.3 /100 | #211 | Tragic 45.3% |
| Creek | 6.4 /100 | #212 | Tragic 45.3% |
| Yakama | 5.8 /100 | #213 | Tragic 45.2% |
| Japanese | 5.7 /100 | #214 | Tragic 45.2% |
| Immigrants | Nepal | 5.6 /100 | #215 | Tragic 45.2% |
| Immigrants | Portugal | 5.6 /100 | #216 | Tragic 45.2% |
| Panamanians | 5.5 /100 | #217 | Tragic 45.2% |
| Immigrants | Azores | 5.3 /100 | #218 | Tragic 45.2% |
| Nicaraguans | 5.3 /100 | #219 | Tragic 45.2% |
Demographics Similar to Immigrants from Venezuela by Married-couple Households
In terms of married-couple households, the demographic groups most similar to Immigrants from Venezuela are Zimbabwean (47.4%, a difference of 0.010%), Australian (47.4%, a difference of 0.030%), Pakistani (47.3%, a difference of 0.060%), Okinawan (47.4%, a difference of 0.080%), and Immigrants from Eastern Europe (47.4%, a difference of 0.10%).
| Demographics | Rating | Rank | Married-couple Households |
| Argentineans | 92.5 /100 | #116 | Exceptional 47.5% |
| French Canadians | 92.4 /100 | #117 | Exceptional 47.5% |
| Immigrants | Germany | 92.4 /100 | #118 | Exceptional 47.5% |
| Chileans | 92.2 /100 | #119 | Exceptional 47.5% |
| Puget Sound Salish | 90.5 /100 | #120 | Exceptional 47.4% |
| Immigrants | Eastern Europe | 90.3 /100 | #121 | Exceptional 47.4% |
| Okinawans | 90.1 /100 | #122 | Exceptional 47.4% |
| Immigrants | Venezuela | 89.3 /100 | #123 | Excellent 47.4% |
| Zimbabweans | 89.2 /100 | #124 | Excellent 47.4% |
| Australians | 89.0 /100 | #125 | Excellent 47.4% |
| Pakistanis | 88.6 /100 | #126 | Excellent 47.3% |
| Celtics | 88.1 /100 | #127 | Excellent 47.3% |
| Immigrants | Peru | 87.9 /100 | #128 | Excellent 47.3% |
| Immigrants | Iraq | 87.8 /100 | #129 | Excellent 47.3% |
| Immigrants | Hungary | 87.8 /100 | #130 | Excellent 47.3% |