Apache vs Immigrants from Sudan Married-couple Households
COMPARE
Apache
Immigrants from Sudan
Married-couple Households
Married-couple Households Comparison
Apache
Immigrants from Sudan
43.9%
MARRIED-COUPLE HOUSEHOLDS
0.3/ 100
METRIC RATING
254th/ 347
METRIC RANK
41.9%
MARRIED-COUPLE HOUSEHOLDS
0.0/ 100
METRIC RATING
296th/ 347
METRIC RANK
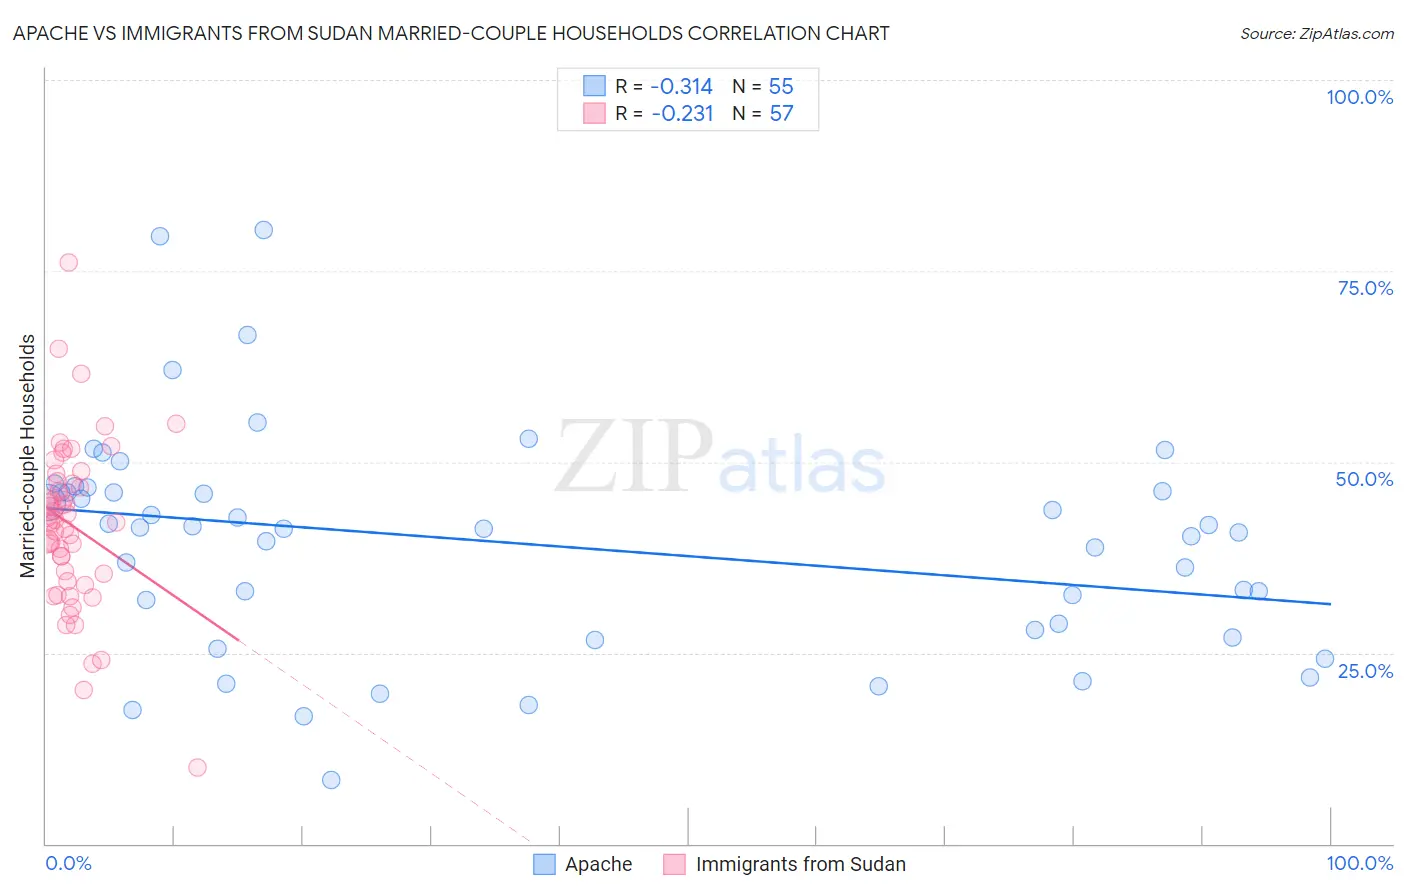
Apache vs Immigrants from Sudan Married-couple Households Correlation Chart
The statistical analysis conducted on geographies consisting of 231,040,334 people shows a mild negative correlation between the proportion of Apache and percentage of married-couple family households in the United States with a correlation coefficient (R) of -0.314 and weighted average of 43.9%. Similarly, the statistical analysis conducted on geographies consisting of 118,946,439 people shows a weak negative correlation between the proportion of Immigrants from Sudan and percentage of married-couple family households in the United States with a correlation coefficient (R) of -0.231 and weighted average of 41.9%, a difference of 4.7%.
Married-couple Households Correlation Summary
| Measurement | Apache | Immigrants from Sudan |
| Minimum | 8.3% | 10.0% |
| Maximum | 80.3% | 76.0% |
| Range | 72.0% | 66.0% |
| Mean | 39.3% | 41.7% |
| Median | 41.3% | 42.1% |
| Interquartile 25% (IQ1) | 28.0% | 34.9% |
| Interquartile 75% (IQ3) | 46.1% | 47.3% |
| Interquartile Range (IQR) | 18.1% | 12.4% |
| Standard Deviation (Sample) | 14.5% | 10.9% |
| Standard Deviation (Population) | 14.4% | 10.8% |
Similar Demographics by Married-couple Households
Demographics Similar to Apache by Married-couple Households
In terms of married-couple households, the demographic groups most similar to Apache are Shoshone (43.9%, a difference of 0.020%), Central American (43.9%, a difference of 0.050%), Ugandan (43.8%, a difference of 0.16%), Seminole (44.0%, a difference of 0.17%), and German Russian (44.0%, a difference of 0.24%).
| Demographics | Rating | Rank | Married-couple Households |
| Immigrants | Morocco | 0.6 /100 | #247 | Tragic 44.2% |
| Yup'ik | 0.4 /100 | #248 | Tragic 44.1% |
| Immigrants | Kenya | 0.4 /100 | #249 | Tragic 44.1% |
| French American Indians | 0.4 /100 | #250 | Tragic 44.1% |
| German Russians | 0.4 /100 | #251 | Tragic 44.0% |
| Seminole | 0.4 /100 | #252 | Tragic 44.0% |
| Central Americans | 0.3 /100 | #253 | Tragic 43.9% |
| Apache | 0.3 /100 | #254 | Tragic 43.9% |
| Shoshone | 0.3 /100 | #255 | Tragic 43.9% |
| Ugandans | 0.3 /100 | #256 | Tragic 43.8% |
| Blackfeet | 0.2 /100 | #257 | Tragic 43.8% |
| Central American Indians | 0.2 /100 | #258 | Tragic 43.8% |
| Iroquois | 0.2 /100 | #259 | Tragic 43.7% |
| Immigrants | Cameroon | 0.2 /100 | #260 | Tragic 43.7% |
| Alaskan Athabascans | 0.2 /100 | #261 | Tragic 43.6% |
Demographics Similar to Immigrants from Sudan by Married-couple Households
In terms of married-couple households, the demographic groups most similar to Immigrants from Sudan are Menominee (42.0%, a difference of 0.11%), Immigrants from Yemen (42.0%, a difference of 0.11%), Kiowa (42.0%, a difference of 0.11%), Indonesian (42.0%, a difference of 0.22%), and Paiute (42.1%, a difference of 0.27%).
| Demographics | Rating | Rank | Married-couple Households |
| Sudanese | 0.0 /100 | #289 | Tragic 42.1% |
| Hondurans | 0.0 /100 | #290 | Tragic 42.1% |
| Paiute | 0.0 /100 | #291 | Tragic 42.1% |
| Indonesians | 0.0 /100 | #292 | Tragic 42.0% |
| Menominee | 0.0 /100 | #293 | Tragic 42.0% |
| Immigrants | Yemen | 0.0 /100 | #294 | Tragic 42.0% |
| Kiowa | 0.0 /100 | #295 | Tragic 42.0% |
| Immigrants | Sudan | 0.0 /100 | #296 | Tragic 41.9% |
| Arapaho | 0.0 /100 | #297 | Tragic 41.8% |
| Immigrants | Middle Africa | 0.0 /100 | #298 | Tragic 41.8% |
| Immigrants | Ghana | 0.0 /100 | #299 | Tragic 41.8% |
| Immigrants | Belize | 0.0 /100 | #300 | Tragic 41.8% |
| Immigrants | Bahamas | 0.0 /100 | #301 | Tragic 41.7% |
| Immigrants | Honduras | 0.0 /100 | #302 | Tragic 41.6% |
| Sub-Saharan Africans | 0.0 /100 | #303 | Tragic 41.6% |