Immigrants from Uruguay vs Immigrants from Sudan Married-couple Households
COMPARE
Immigrants from Uruguay
Immigrants from Sudan
Married-couple Households
Married-couple Households Comparison
Immigrants from Uruguay
Immigrants from Sudan
44.5%
MARRIED-COUPLE HOUSEHOLDS
1.1/ 100
METRIC RATING
238th/ 347
METRIC RANK
41.9%
MARRIED-COUPLE HOUSEHOLDS
0.0/ 100
METRIC RATING
296th/ 347
METRIC RANK
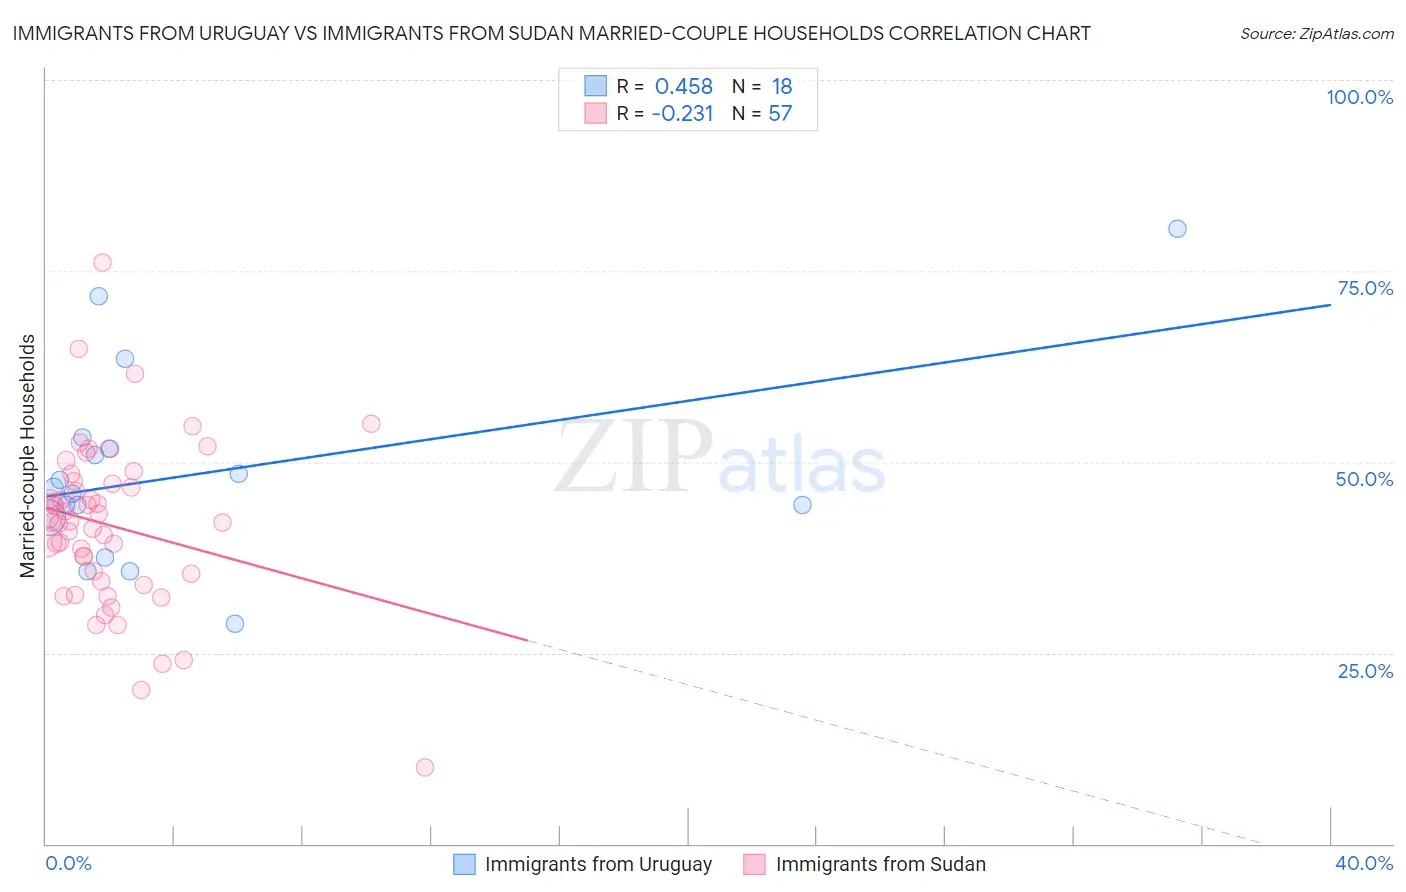
Immigrants from Uruguay vs Immigrants from Sudan Married-couple Households Correlation Chart
The statistical analysis conducted on geographies consisting of 133,245,142 people shows a moderate positive correlation between the proportion of Immigrants from Uruguay and percentage of married-couple family households in the United States with a correlation coefficient (R) of 0.458 and weighted average of 44.5%. Similarly, the statistical analysis conducted on geographies consisting of 118,946,439 people shows a weak negative correlation between the proportion of Immigrants from Sudan and percentage of married-couple family households in the United States with a correlation coefficient (R) of -0.231 and weighted average of 41.9%, a difference of 6.1%.
Married-couple Households Correlation Summary
| Measurement | Immigrants from Uruguay | Immigrants from Sudan |
| Minimum | 28.8% | 10.0% |
| Maximum | 80.5% | 76.0% |
| Range | 51.7% | 66.0% |
| Mean | 48.5% | 41.7% |
| Median | 46.2% | 42.1% |
| Interquartile 25% (IQ1) | 42.8% | 34.9% |
| Interquartile 75% (IQ3) | 51.7% | 47.3% |
| Interquartile Range (IQR) | 8.9% | 12.4% |
| Standard Deviation (Sample) | 12.7% | 10.9% |
| Standard Deviation (Population) | 12.4% | 10.8% |
Similar Demographics by Married-couple Households
Demographics Similar to Immigrants from Uruguay by Married-couple Households
In terms of married-couple households, the demographic groups most similar to Immigrants from Uruguay are Spanish American (44.5%, a difference of 0.020%), Comanche (44.5%, a difference of 0.050%), Yaqui (44.5%, a difference of 0.080%), Immigrants from Nicaragua (44.5%, a difference of 0.090%), and Ute (44.4%, a difference of 0.10%).
| Demographics | Rating | Rank | Married-couple Households |
| Houma | 1.5 /100 | #231 | Tragic 44.6% |
| Marshallese | 1.5 /100 | #232 | Tragic 44.6% |
| Immigrants | Uganda | 1.5 /100 | #233 | Tragic 44.6% |
| Immigrants | Panama | 1.3 /100 | #234 | Tragic 44.6% |
| Immigrants | Nicaragua | 1.2 /100 | #235 | Tragic 44.5% |
| Yaqui | 1.2 /100 | #236 | Tragic 44.5% |
| Comanche | 1.2 /100 | #237 | Tragic 44.5% |
| Immigrants | Uruguay | 1.1 /100 | #238 | Tragic 44.5% |
| Spanish Americans | 1.1 /100 | #239 | Tragic 44.5% |
| Ute | 1.0 /100 | #240 | Tragic 44.4% |
| Immigrants | Bosnia and Herzegovina | 1.0 /100 | #241 | Tragic 44.4% |
| Immigrants | Albania | 1.0 /100 | #242 | Tragic 44.4% |
| Immigrants | Saudi Arabia | 0.9 /100 | #243 | Tragic 44.4% |
| Immigrants | Armenia | 0.7 /100 | #244 | Tragic 44.3% |
| Immigrants | El Salvador | 0.7 /100 | #245 | Tragic 44.3% |
Demographics Similar to Immigrants from Sudan by Married-couple Households
In terms of married-couple households, the demographic groups most similar to Immigrants from Sudan are Menominee (42.0%, a difference of 0.11%), Immigrants from Yemen (42.0%, a difference of 0.11%), Kiowa (42.0%, a difference of 0.11%), Indonesian (42.0%, a difference of 0.22%), and Paiute (42.1%, a difference of 0.27%).
| Demographics | Rating | Rank | Married-couple Households |
| Sudanese | 0.0 /100 | #289 | Tragic 42.1% |
| Hondurans | 0.0 /100 | #290 | Tragic 42.1% |
| Paiute | 0.0 /100 | #291 | Tragic 42.1% |
| Indonesians | 0.0 /100 | #292 | Tragic 42.0% |
| Menominee | 0.0 /100 | #293 | Tragic 42.0% |
| Immigrants | Yemen | 0.0 /100 | #294 | Tragic 42.0% |
| Kiowa | 0.0 /100 | #295 | Tragic 42.0% |
| Immigrants | Sudan | 0.0 /100 | #296 | Tragic 41.9% |
| Arapaho | 0.0 /100 | #297 | Tragic 41.8% |
| Immigrants | Middle Africa | 0.0 /100 | #298 | Tragic 41.8% |
| Immigrants | Ghana | 0.0 /100 | #299 | Tragic 41.8% |
| Immigrants | Belize | 0.0 /100 | #300 | Tragic 41.8% |
| Immigrants | Bahamas | 0.0 /100 | #301 | Tragic 41.7% |
| Immigrants | Honduras | 0.0 /100 | #302 | Tragic 41.6% |
| Sub-Saharan Africans | 0.0 /100 | #303 | Tragic 41.6% |