Creek vs Immigrants from Panama Married-couple Households
COMPARE
Creek
Immigrants from Panama
Married-couple Households
Married-couple Households Comparison
Creek
Immigrants from Panama
45.3%
MARRIED-COUPLE HOUSEHOLDS
6.4/ 100
METRIC RATING
212th/ 347
METRIC RANK
44.6%
MARRIED-COUPLE HOUSEHOLDS
1.3/ 100
METRIC RATING
234th/ 347
METRIC RANK
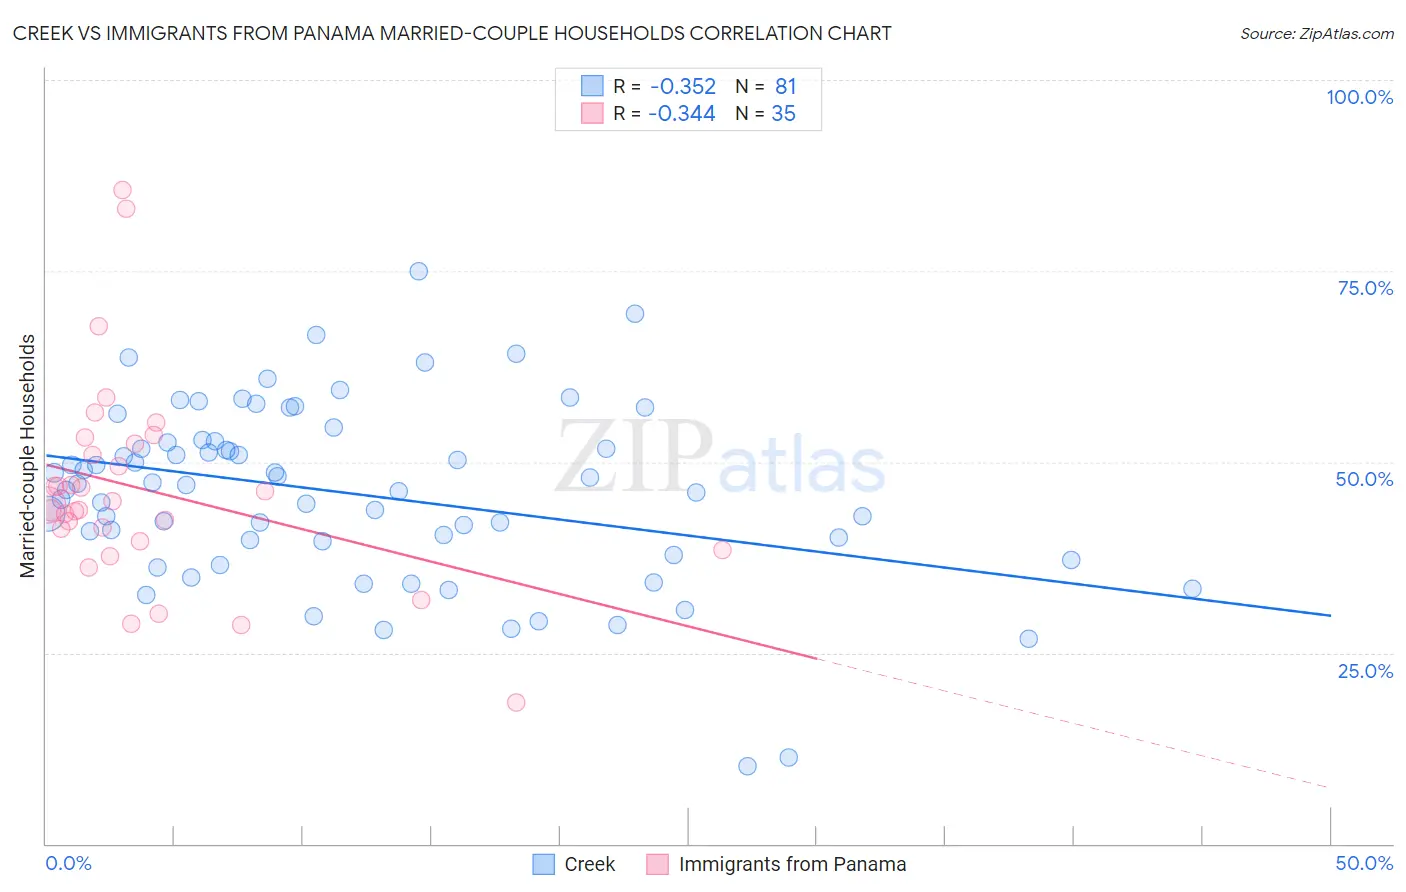
Creek vs Immigrants from Panama Married-couple Households Correlation Chart
The statistical analysis conducted on geographies consisting of 178,433,601 people shows a mild negative correlation between the proportion of Creek and percentage of married-couple family households in the United States with a correlation coefficient (R) of -0.352 and weighted average of 45.3%. Similarly, the statistical analysis conducted on geographies consisting of 221,156,465 people shows a mild negative correlation between the proportion of Immigrants from Panama and percentage of married-couple family households in the United States with a correlation coefficient (R) of -0.344 and weighted average of 44.6%, a difference of 1.6%.
Married-couple Households Correlation Summary
| Measurement | Creek | Immigrants from Panama |
| Minimum | 10.1% | 18.6% |
| Maximum | 75.0% | 85.7% |
| Range | 64.9% | 67.1% |
| Mean | 45.8% | 46.3% |
| Median | 47.0% | 44.4% |
| Interquartile 25% (IQ1) | 38.8% | 39.6% |
| Interquartile 75% (IQ3) | 52.6% | 52.4% |
| Interquartile Range (IQR) | 13.9% | 12.9% |
| Standard Deviation (Sample) | 11.8% | 13.4% |
| Standard Deviation (Population) | 11.7% | 13.2% |
Similar Demographics by Married-couple Households
Demographics Similar to Creek by Married-couple Households
In terms of married-couple households, the demographic groups most similar to Creek are Yakama (45.2%, a difference of 0.10%), Immigrants from Spain (45.3%, a difference of 0.13%), Japanese (45.2%, a difference of 0.13%), Immigrants from Nepal (45.2%, a difference of 0.15%), and Immigrants from Portugal (45.2%, a difference of 0.15%).
| Demographics | Rating | Rank | Married-couple Households |
| Nepalese | 11.9 /100 | #205 | Poor 45.6% |
| Uruguayans | 10.4 /100 | #206 | Poor 45.5% |
| Immigrants | France | 8.8 /100 | #207 | Tragic 45.4% |
| Hispanics or Latinos | 8.7 /100 | #208 | Tragic 45.4% |
| Immigrants | Uzbekistan | 8.4 /100 | #209 | Tragic 45.4% |
| Cubans | 7.7 /100 | #210 | Tragic 45.4% |
| Immigrants | Spain | 7.3 /100 | #211 | Tragic 45.3% |
| Creek | 6.4 /100 | #212 | Tragic 45.3% |
| Yakama | 5.8 /100 | #213 | Tragic 45.2% |
| Japanese | 5.7 /100 | #214 | Tragic 45.2% |
| Immigrants | Nepal | 5.6 /100 | #215 | Tragic 45.2% |
| Immigrants | Portugal | 5.6 /100 | #216 | Tragic 45.2% |
| Panamanians | 5.5 /100 | #217 | Tragic 45.2% |
| Immigrants | Azores | 5.3 /100 | #218 | Tragic 45.2% |
| Nicaraguans | 5.3 /100 | #219 | Tragic 45.2% |
Demographics Similar to Immigrants from Panama by Married-couple Households
In terms of married-couple households, the demographic groups most similar to Immigrants from Panama are Immigrants from Nicaragua (44.5%, a difference of 0.070%), Yaqui (44.5%, a difference of 0.080%), Comanche (44.5%, a difference of 0.11%), Immigrants from Uganda (44.6%, a difference of 0.12%), and Houma (44.6%, a difference of 0.16%).
| Demographics | Rating | Rank | Married-couple Households |
| Salvadorans | 1.9 /100 | #227 | Tragic 44.7% |
| Kenyans | 1.7 /100 | #228 | Tragic 44.7% |
| Immigrants | Latin America | 1.6 /100 | #229 | Tragic 44.7% |
| Soviet Union | 1.6 /100 | #230 | Tragic 44.6% |
| Houma | 1.5 /100 | #231 | Tragic 44.6% |
| Marshallese | 1.5 /100 | #232 | Tragic 44.6% |
| Immigrants | Uganda | 1.5 /100 | #233 | Tragic 44.6% |
| Immigrants | Panama | 1.3 /100 | #234 | Tragic 44.6% |
| Immigrants | Nicaragua | 1.2 /100 | #235 | Tragic 44.5% |
| Yaqui | 1.2 /100 | #236 | Tragic 44.5% |
| Comanche | 1.2 /100 | #237 | Tragic 44.5% |
| Immigrants | Uruguay | 1.1 /100 | #238 | Tragic 44.5% |
| Spanish Americans | 1.1 /100 | #239 | Tragic 44.5% |
| Ute | 1.0 /100 | #240 | Tragic 44.4% |
| Immigrants | Bosnia and Herzegovina | 1.0 /100 | #241 | Tragic 44.4% |