Creek vs Immigrants from Sudan 5th Grade
COMPARE
Creek
Immigrants from Sudan
5th Grade
5th Grade Comparison
Creek
Immigrants from Sudan
98.0%
5TH GRADE
99.8/ 100
METRIC RATING
55th/ 347
METRIC RANK
97.1%
5TH GRADE
6.5/ 100
METRIC RATING
218th/ 347
METRIC RANK
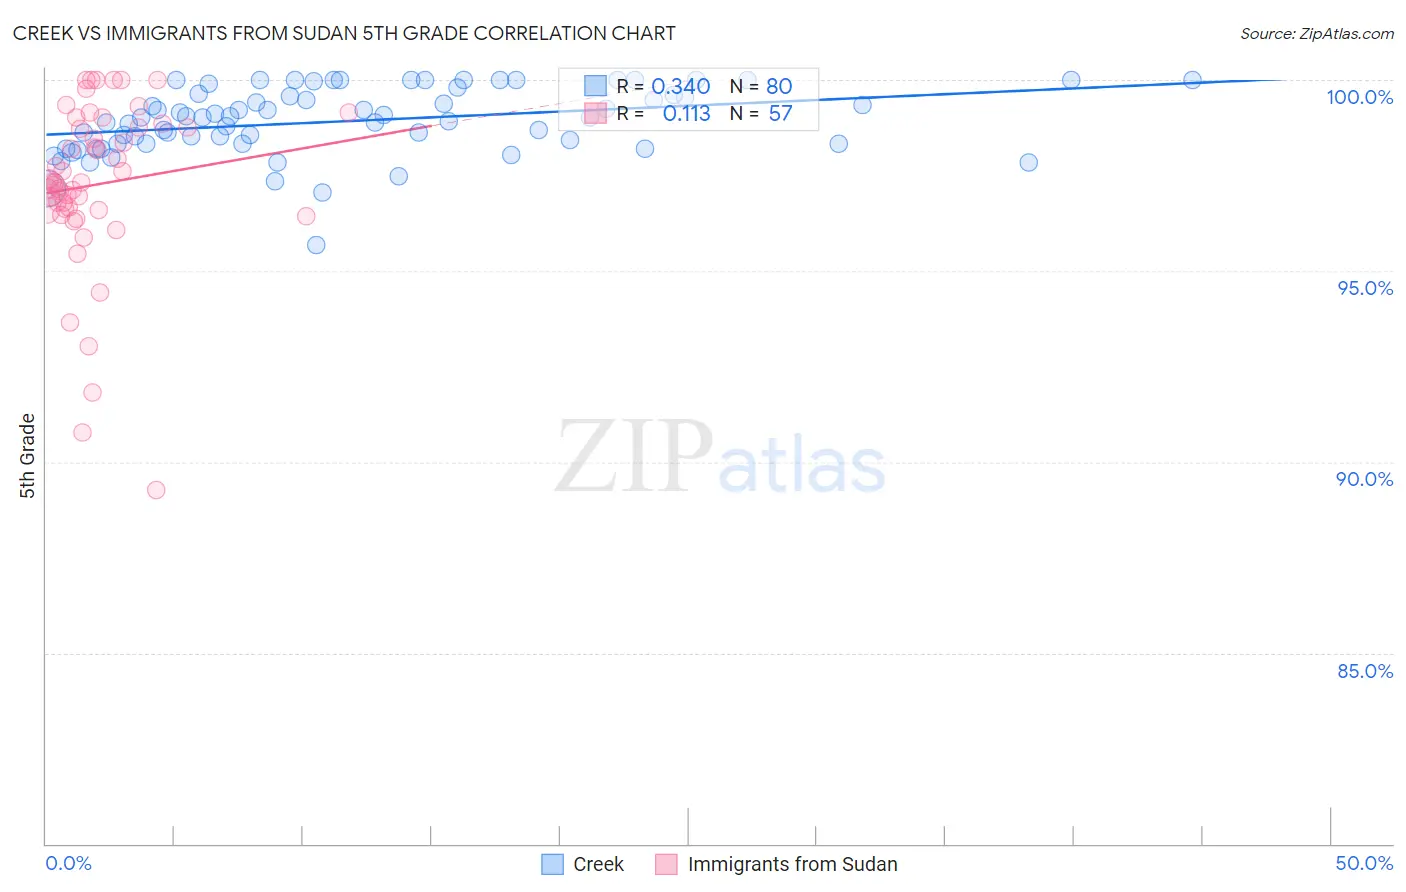
Creek vs Immigrants from Sudan 5th Grade Correlation Chart
The statistical analysis conducted on geographies consisting of 178,480,663 people shows a mild positive correlation between the proportion of Creek and percentage of population with at least 5th grade education in the United States with a correlation coefficient (R) of 0.340 and weighted average of 98.0%. Similarly, the statistical analysis conducted on geographies consisting of 118,959,807 people shows a poor positive correlation between the proportion of Immigrants from Sudan and percentage of population with at least 5th grade education in the United States with a correlation coefficient (R) of 0.113 and weighted average of 97.1%, a difference of 0.92%.
5th Grade Correlation Summary
| Measurement | Creek | Immigrants from Sudan |
| Minimum | 95.7% | 89.3% |
| Maximum | 100.0% | 100.0% |
| Range | 4.3% | 10.7% |
| Mean | 98.9% | 97.3% |
| Median | 99.0% | 97.3% |
| Interquartile 25% (IQ1) | 98.3% | 96.6% |
| Interquartile 75% (IQ3) | 99.6% | 98.8% |
| Interquartile Range (IQR) | 1.3% | 2.2% |
| Standard Deviation (Sample) | 0.87% | 2.2% |
| Standard Deviation (Population) | 0.87% | 2.2% |
Similar Demographics by 5th Grade
Demographics Similar to Creek by 5th Grade
In terms of 5th grade, the demographic groups most similar to Creek are Greek (97.9%, a difference of 0.0%), Austrian (97.9%, a difference of 0.0%), Slavic (98.0%, a difference of 0.010%), Australian (98.0%, a difference of 0.010%), and White/Caucasian (97.9%, a difference of 0.010%).
| Demographics | Rating | Rank | 5th Grade |
| Bulgarians | 99.8 /100 | #48 | Exceptional 98.0% |
| Estonians | 99.8 /100 | #49 | Exceptional 98.0% |
| Immigrants | Scotland | 99.8 /100 | #50 | Exceptional 98.0% |
| Celtics | 99.8 /100 | #51 | Exceptional 98.0% |
| Maltese | 99.8 /100 | #52 | Exceptional 98.0% |
| Slavs | 99.8 /100 | #53 | Exceptional 98.0% |
| Australians | 99.8 /100 | #54 | Exceptional 98.0% |
| Creek | 99.8 /100 | #55 | Exceptional 98.0% |
| Greeks | 99.8 /100 | #56 | Exceptional 97.9% |
| Austrians | 99.8 /100 | #57 | Exceptional 97.9% |
| Whites/Caucasians | 99.8 /100 | #58 | Exceptional 97.9% |
| Americans | 99.7 /100 | #59 | Exceptional 97.9% |
| Immigrants | Canada | 99.7 /100 | #60 | Exceptional 97.9% |
| Serbians | 99.7 /100 | #61 | Exceptional 97.9% |
| Immigrants | North America | 99.7 /100 | #62 | Exceptional 97.9% |
Demographics Similar to Immigrants from Sudan by 5th Grade
In terms of 5th grade, the demographic groups most similar to Immigrants from Sudan are Immigrants from Lebanon (97.1%, a difference of 0.0%), Immigrants from Syria (97.1%, a difference of 0.0%), Immigrants from Southern Europe (97.1%, a difference of 0.0%), Immigrants from Morocco (97.1%, a difference of 0.010%), and Sudanese (97.1%, a difference of 0.010%).
| Demographics | Rating | Rank | 5th Grade |
| Samoans | 8.5 /100 | #211 | Tragic 97.1% |
| Immigrants | Iraq | 8.3 /100 | #212 | Tragic 97.1% |
| Portuguese | 7.8 /100 | #213 | Tragic 97.1% |
| Costa Ricans | 7.7 /100 | #214 | Tragic 97.1% |
| Immigrants | Morocco | 7.5 /100 | #215 | Tragic 97.1% |
| Sudanese | 7.0 /100 | #216 | Tragic 97.1% |
| Immigrants | Lebanon | 6.8 /100 | #217 | Tragic 97.1% |
| Immigrants | Sudan | 6.5 /100 | #218 | Tragic 97.1% |
| Immigrants | Syria | 6.4 /100 | #219 | Tragic 97.1% |
| Immigrants | Southern Europe | 6.3 /100 | #220 | Tragic 97.1% |
| Sierra Leoneans | 6.0 /100 | #221 | Tragic 97.1% |
| Immigrants | Panama | 5.7 /100 | #222 | Tragic 97.0% |
| Liberians | 5.7 /100 | #223 | Tragic 97.0% |
| South American Indians | 5.4 /100 | #224 | Tragic 97.0% |
| Bahamians | 5.3 /100 | #225 | Tragic 97.0% |