Immigrants from Ecuador vs Immigrants from Sudan Married-couple Households
COMPARE
Immigrants from Ecuador
Immigrants from Sudan
Married-couple Households
Married-couple Households Comparison
Immigrants from Ecuador
Immigrants from Sudan
42.9%
MARRIED-COUPLE HOUSEHOLDS
0.0/ 100
METRIC RATING
280th/ 347
METRIC RANK
41.9%
MARRIED-COUPLE HOUSEHOLDS
0.0/ 100
METRIC RATING
296th/ 347
METRIC RANK
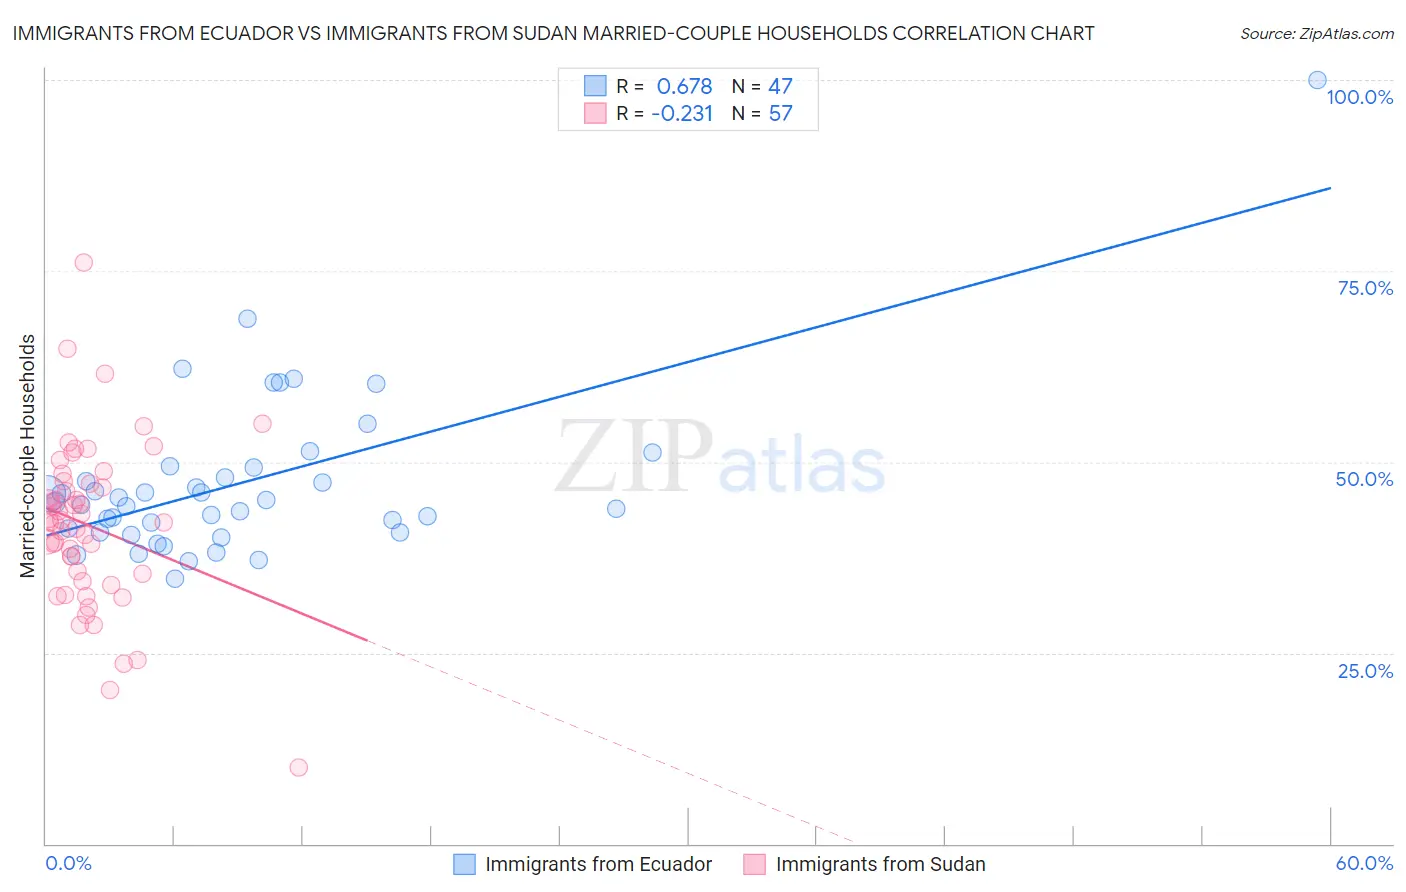
Immigrants from Ecuador vs Immigrants from Sudan Married-couple Households Correlation Chart
The statistical analysis conducted on geographies consisting of 270,883,052 people shows a significant positive correlation between the proportion of Immigrants from Ecuador and percentage of married-couple family households in the United States with a correlation coefficient (R) of 0.678 and weighted average of 42.9%. Similarly, the statistical analysis conducted on geographies consisting of 118,946,439 people shows a weak negative correlation between the proportion of Immigrants from Sudan and percentage of married-couple family households in the United States with a correlation coefficient (R) of -0.231 and weighted average of 41.9%, a difference of 2.2%.
Married-couple Households Correlation Summary
| Measurement | Immigrants from Ecuador | Immigrants from Sudan |
| Minimum | 34.8% | 10.0% |
| Maximum | 100.0% | 76.0% |
| Range | 65.2% | 66.0% |
| Mean | 47.2% | 41.7% |
| Median | 44.7% | 42.1% |
| Interquartile 25% (IQ1) | 40.8% | 34.9% |
| Interquartile 75% (IQ3) | 49.2% | 47.3% |
| Interquartile Range (IQR) | 8.5% | 12.4% |
| Standard Deviation (Sample) | 10.9% | 10.9% |
| Standard Deviation (Population) | 10.8% | 10.8% |
Demographics Similar to Immigrants from Ecuador and Immigrants from Sudan by Married-couple Households
In terms of married-couple households, the demographic groups most similar to Immigrants from Ecuador are Sierra Leonean (42.9%, a difference of 0.050%), Immigrants from Guatemala (42.8%, a difference of 0.070%), Immigrants from Africa (42.9%, a difference of 0.080%), Bermudan (42.4%, a difference of 0.97%), and Inupiat (42.4%, a difference of 1.1%). Similarly, the demographic groups most similar to Immigrants from Sudan are Menominee (42.0%, a difference of 0.11%), Immigrants from Yemen (42.0%, a difference of 0.11%), Kiowa (42.0%, a difference of 0.11%), Indonesian (42.0%, a difference of 0.22%), and Paiute (42.1%, a difference of 0.27%).
| Demographics | Rating | Rank | Married-couple Households |
| Immigrants | Africa | 0.0 /100 | #278 | Tragic 42.9% |
| Sierra Leoneans | 0.0 /100 | #279 | Tragic 42.9% |
| Immigrants | Ecuador | 0.0 /100 | #280 | Tragic 42.9% |
| Immigrants | Guatemala | 0.0 /100 | #281 | Tragic 42.8% |
| Bermudans | 0.0 /100 | #282 | Tragic 42.4% |
| Inupiat | 0.0 /100 | #283 | Tragic 42.4% |
| Cheyenne | 0.0 /100 | #284 | Tragic 42.3% |
| Ghanaians | 0.0 /100 | #285 | Tragic 42.2% |
| Belizeans | 0.0 /100 | #286 | Tragic 42.2% |
| Chippewa | 0.0 /100 | #287 | Tragic 42.1% |
| Immigrants | Eritrea | 0.0 /100 | #288 | Tragic 42.1% |
| Sudanese | 0.0 /100 | #289 | Tragic 42.1% |
| Hondurans | 0.0 /100 | #290 | Tragic 42.1% |
| Paiute | 0.0 /100 | #291 | Tragic 42.1% |
| Indonesians | 0.0 /100 | #292 | Tragic 42.0% |
| Menominee | 0.0 /100 | #293 | Tragic 42.0% |
| Immigrants | Yemen | 0.0 /100 | #294 | Tragic 42.0% |
| Kiowa | 0.0 /100 | #295 | Tragic 42.0% |
| Immigrants | Sudan | 0.0 /100 | #296 | Tragic 41.9% |
| Arapaho | 0.0 /100 | #297 | Tragic 41.8% |
| Immigrants | Middle Africa | 0.0 /100 | #298 | Tragic 41.8% |