Creek vs Immigrants from Vietnam Married-couple Households
COMPARE
Creek
Immigrants from Vietnam
Married-couple Households
Married-couple Households Comparison
Creek
Immigrants from Vietnam
45.3%
MARRIED-COUPLE HOUSEHOLDS
6.4/ 100
METRIC RATING
212th/ 347
METRIC RANK
48.8%
MARRIED-COUPLE HOUSEHOLDS
99.6/ 100
METRIC RATING
42nd/ 347
METRIC RANK
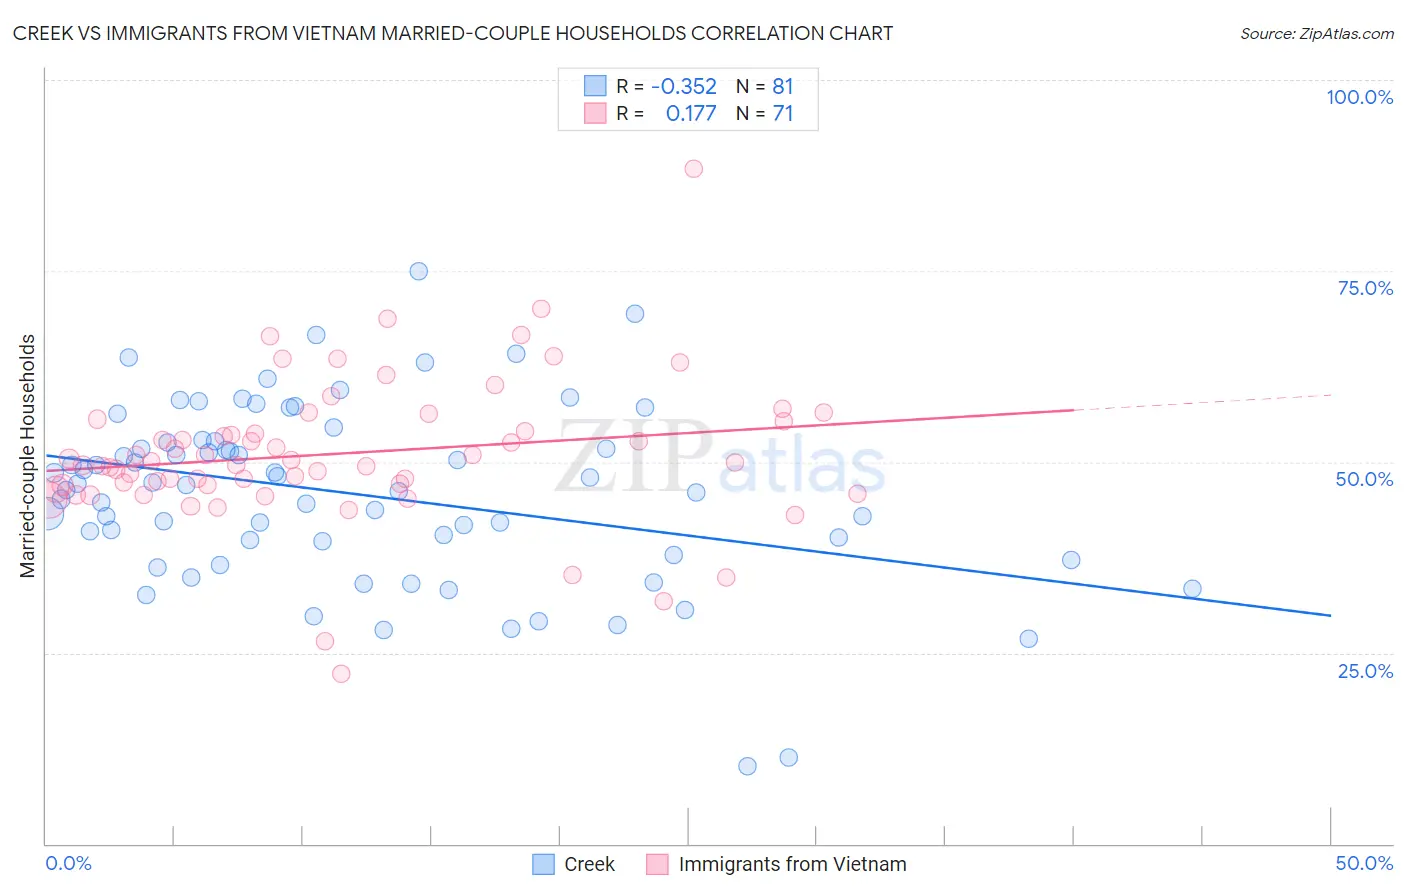
Creek vs Immigrants from Vietnam Married-couple Households Correlation Chart
The statistical analysis conducted on geographies consisting of 178,433,601 people shows a mild negative correlation between the proportion of Creek and percentage of married-couple family households in the United States with a correlation coefficient (R) of -0.352 and weighted average of 45.3%. Similarly, the statistical analysis conducted on geographies consisting of 404,551,130 people shows a poor positive correlation between the proportion of Immigrants from Vietnam and percentage of married-couple family households in the United States with a correlation coefficient (R) of 0.177 and weighted average of 48.8%, a difference of 7.9%.
Married-couple Households Correlation Summary
| Measurement | Creek | Immigrants from Vietnam |
| Minimum | 10.1% | 22.2% |
| Maximum | 75.0% | 88.5% |
| Range | 64.9% | 66.2% |
| Mean | 45.8% | 51.1% |
| Median | 47.0% | 49.9% |
| Interquartile 25% (IQ1) | 38.8% | 47.0% |
| Interquartile 75% (IQ3) | 52.6% | 55.3% |
| Interquartile Range (IQR) | 13.9% | 8.3% |
| Standard Deviation (Sample) | 11.8% | 9.7% |
| Standard Deviation (Population) | 11.7% | 9.6% |
Similar Demographics by Married-couple Households
Demographics Similar to Creek by Married-couple Households
In terms of married-couple households, the demographic groups most similar to Creek are Yakama (45.2%, a difference of 0.10%), Immigrants from Spain (45.3%, a difference of 0.13%), Japanese (45.2%, a difference of 0.13%), Immigrants from Nepal (45.2%, a difference of 0.15%), and Immigrants from Portugal (45.2%, a difference of 0.15%).
| Demographics | Rating | Rank | Married-couple Households |
| Nepalese | 11.9 /100 | #205 | Poor 45.6% |
| Uruguayans | 10.4 /100 | #206 | Poor 45.5% |
| Immigrants | France | 8.8 /100 | #207 | Tragic 45.4% |
| Hispanics or Latinos | 8.7 /100 | #208 | Tragic 45.4% |
| Immigrants | Uzbekistan | 8.4 /100 | #209 | Tragic 45.4% |
| Cubans | 7.7 /100 | #210 | Tragic 45.4% |
| Immigrants | Spain | 7.3 /100 | #211 | Tragic 45.3% |
| Creek | 6.4 /100 | #212 | Tragic 45.3% |
| Yakama | 5.8 /100 | #213 | Tragic 45.2% |
| Japanese | 5.7 /100 | #214 | Tragic 45.2% |
| Immigrants | Nepal | 5.6 /100 | #215 | Tragic 45.2% |
| Immigrants | Portugal | 5.6 /100 | #216 | Tragic 45.2% |
| Panamanians | 5.5 /100 | #217 | Tragic 45.2% |
| Immigrants | Azores | 5.3 /100 | #218 | Tragic 45.2% |
| Nicaraguans | 5.3 /100 | #219 | Tragic 45.2% |
Demographics Similar to Immigrants from Vietnam by Married-couple Households
In terms of married-couple households, the demographic groups most similar to Immigrants from Vietnam are Immigrants from Lebanon (48.9%, a difference of 0.050%), Immigrants from Iran (48.8%, a difference of 0.060%), Immigrants from Bolivia (48.9%, a difference of 0.080%), Lithuanian (48.9%, a difference of 0.090%), and Welsh (48.8%, a difference of 0.10%).
| Demographics | Rating | Rank | Married-couple Households |
| Scottish | 99.7 /100 | #35 | Exceptional 49.0% |
| Iranians | 99.7 /100 | #36 | Exceptional 49.0% |
| Sri Lankans | 99.7 /100 | #37 | Exceptional 49.0% |
| Greeks | 99.7 /100 | #38 | Exceptional 48.9% |
| Lithuanians | 99.6 /100 | #39 | Exceptional 48.9% |
| Immigrants | Bolivia | 99.6 /100 | #40 | Exceptional 48.9% |
| Immigrants | Lebanon | 99.6 /100 | #41 | Exceptional 48.9% |
| Immigrants | Vietnam | 99.6 /100 | #42 | Exceptional 48.8% |
| Immigrants | Iran | 99.6 /100 | #43 | Exceptional 48.8% |
| Welsh | 99.5 /100 | #44 | Exceptional 48.8% |
| Immigrants | Eastern Asia | 99.5 /100 | #45 | Exceptional 48.8% |
| Tsimshian | 99.5 /100 | #46 | Exceptional 48.7% |
| British | 99.5 /100 | #47 | Exceptional 48.7% |
| Indians (Asian) | 99.4 /100 | #48 | Exceptional 48.7% |
| Immigrants | Sri Lanka | 99.4 /100 | #49 | Exceptional 48.7% |