Cherokee vs South African Married-couple Households
COMPARE
Cherokee
South African
Married-couple Households
Married-couple Households Comparison
Cherokee
South Africans
46.7%
MARRIED-COUPLE HOUSEHOLDS
65.7/ 100
METRIC RATING
166th/ 347
METRIC RANK
47.3%
MARRIED-COUPLE HOUSEHOLDS
86.4/ 100
METRIC RATING
133rd/ 347
METRIC RANK
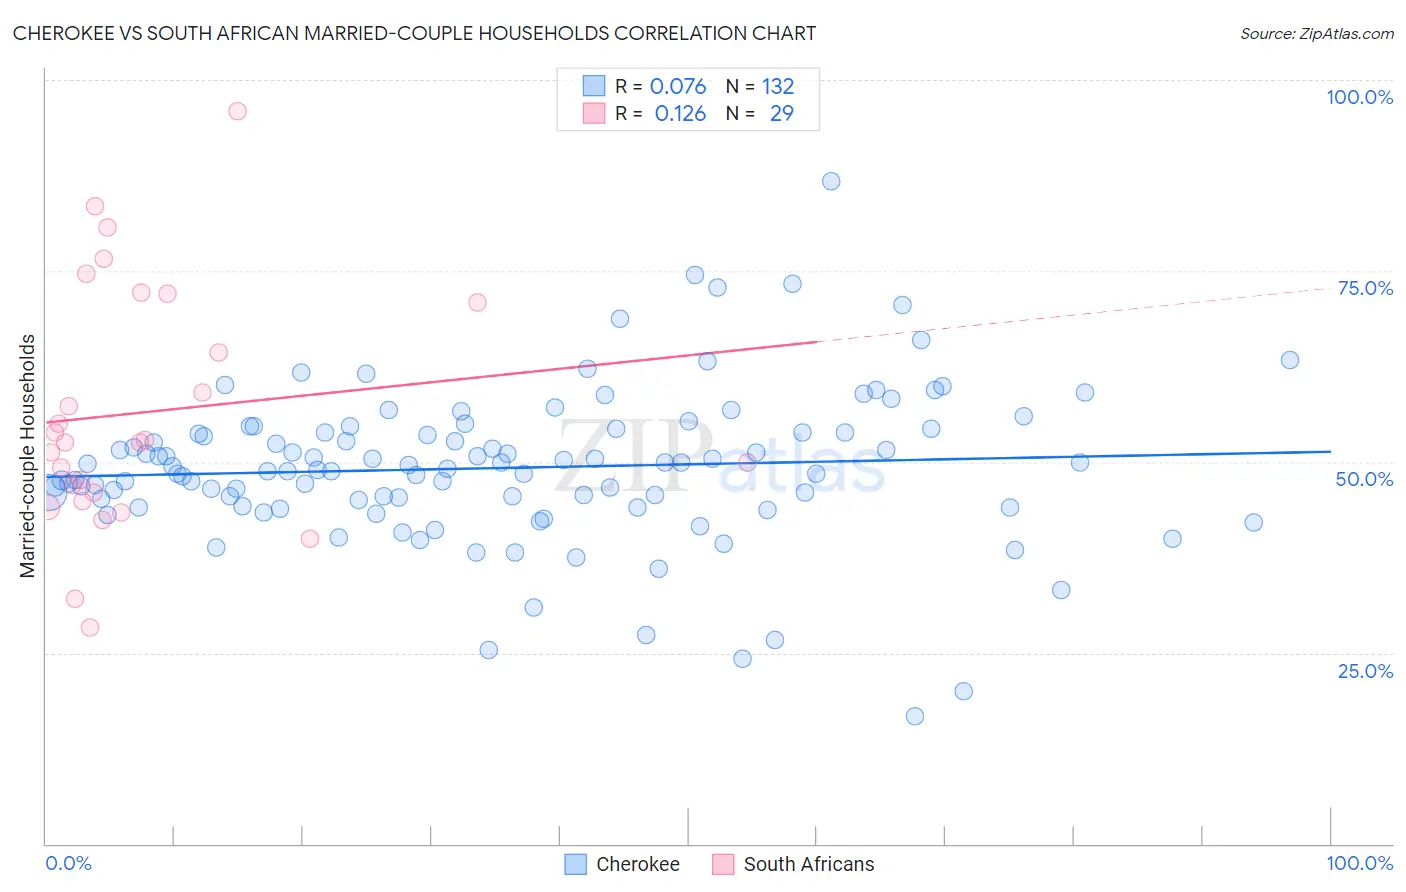
Cherokee vs South African Married-couple Households Correlation Chart
The statistical analysis conducted on geographies consisting of 493,370,237 people shows a slight positive correlation between the proportion of Cherokee and percentage of married-couple family households in the United States with a correlation coefficient (R) of 0.076 and weighted average of 46.7%. Similarly, the statistical analysis conducted on geographies consisting of 182,537,045 people shows a poor positive correlation between the proportion of South Africans and percentage of married-couple family households in the United States with a correlation coefficient (R) of 0.126 and weighted average of 47.3%, a difference of 1.1%.
Married-couple Households Correlation Summary
| Measurement | Cherokee | South African |
| Minimum | 16.7% | 28.3% |
| Maximum | 86.8% | 96.0% |
| Range | 70.2% | 67.7% |
| Mean | 49.2% | 56.6% |
| Median | 49.0% | 52.6% |
| Interquartile 25% (IQ1) | 44.6% | 45.4% |
| Interquartile 75% (IQ3) | 53.9% | 71.4% |
| Interquartile Range (IQR) | 9.3% | 26.0% |
| Standard Deviation (Sample) | 10.1% | 16.0% |
| Standard Deviation (Population) | 10.1% | 15.7% |
Similar Demographics by Married-couple Households
Demographics Similar to Cherokee by Married-couple Households
In terms of married-couple households, the demographic groups most similar to Cherokee are Immigrants from Croatia (46.7%, a difference of 0.060%), Israeli (46.7%, a difference of 0.14%), Immigrants from Kazakhstan (46.8%, a difference of 0.18%), Immigrants from Southern Europe (46.8%, a difference of 0.18%), and Immigrants from Turkey (46.8%, a difference of 0.19%).
| Demographics | Rating | Rank | Married-couple Households |
| Osage | 73.2 /100 | #159 | Good 46.9% |
| Iraqis | 71.7 /100 | #160 | Good 46.9% |
| Delaware | 71.2 /100 | #161 | Good 46.8% |
| Colombians | 71.0 /100 | #162 | Good 46.8% |
| Immigrants | Turkey | 70.2 /100 | #163 | Good 46.8% |
| Immigrants | Kazakhstan | 70.0 /100 | #164 | Good 46.8% |
| Immigrants | Southern Europe | 69.9 /100 | #165 | Good 46.8% |
| Cherokee | 65.7 /100 | #166 | Good 46.7% |
| Immigrants | Croatia | 64.2 /100 | #167 | Good 46.7% |
| Israelis | 62.3 /100 | #168 | Good 46.7% |
| Spanish American Indians | 59.4 /100 | #169 | Average 46.6% |
| South Americans | 58.0 /100 | #170 | Average 46.6% |
| Immigrants | Chile | 55.7 /100 | #171 | Average 46.5% |
| Immigrants | Australia | 54.6 /100 | #172 | Average 46.5% |
| Immigrants | Norway | 52.0 /100 | #173 | Average 46.5% |
Demographics Similar to South Africans by Married-couple Households
In terms of married-couple households, the demographic groups most similar to South Africans are Immigrants from Ukraine (47.3%, a difference of 0.020%), Immigrants from Greece (47.2%, a difference of 0.040%), Immigrants from Argentina (47.2%, a difference of 0.040%), Immigrants from Denmark (47.3%, a difference of 0.090%), and New Zealander (47.2%, a difference of 0.090%).
| Demographics | Rating | Rank | Married-couple Households |
| Pakistanis | 88.6 /100 | #126 | Excellent 47.3% |
| Celtics | 88.1 /100 | #127 | Excellent 47.3% |
| Immigrants | Peru | 87.9 /100 | #128 | Excellent 47.3% |
| Immigrants | Iraq | 87.8 /100 | #129 | Excellent 47.3% |
| Immigrants | Hungary | 87.8 /100 | #130 | Excellent 47.3% |
| Immigrants | Denmark | 87.5 /100 | #131 | Excellent 47.3% |
| Immigrants | Ukraine | 86.7 /100 | #132 | Excellent 47.3% |
| South Africans | 86.4 /100 | #133 | Excellent 47.3% |
| Immigrants | Greece | 86.0 /100 | #134 | Excellent 47.2% |
| Immigrants | Argentina | 86.0 /100 | #135 | Excellent 47.2% |
| New Zealanders | 85.3 /100 | #136 | Excellent 47.2% |
| Immigrants | Malaysia | 85.2 /100 | #137 | Excellent 47.2% |
| Immigrants | Afghanistan | 85.1 /100 | #138 | Excellent 47.2% |
| Immigrants | Sweden | 84.7 /100 | #139 | Excellent 47.2% |
| Spanish | 84.5 /100 | #140 | Excellent 47.2% |