Scandinavian vs Comanche Bachelor's Degree
COMPARE
Scandinavian
Comanche
Bachelor's Degree
Bachelor's Degree Comparison
Scandinavians
Comanche
37.5%
BACHELOR'S DEGREE
41.7/ 100
METRIC RATING
184th/ 347
METRIC RANK
31.9%
BACHELOR'S DEGREE
0.2/ 100
METRIC RATING
272nd/ 347
METRIC RANK
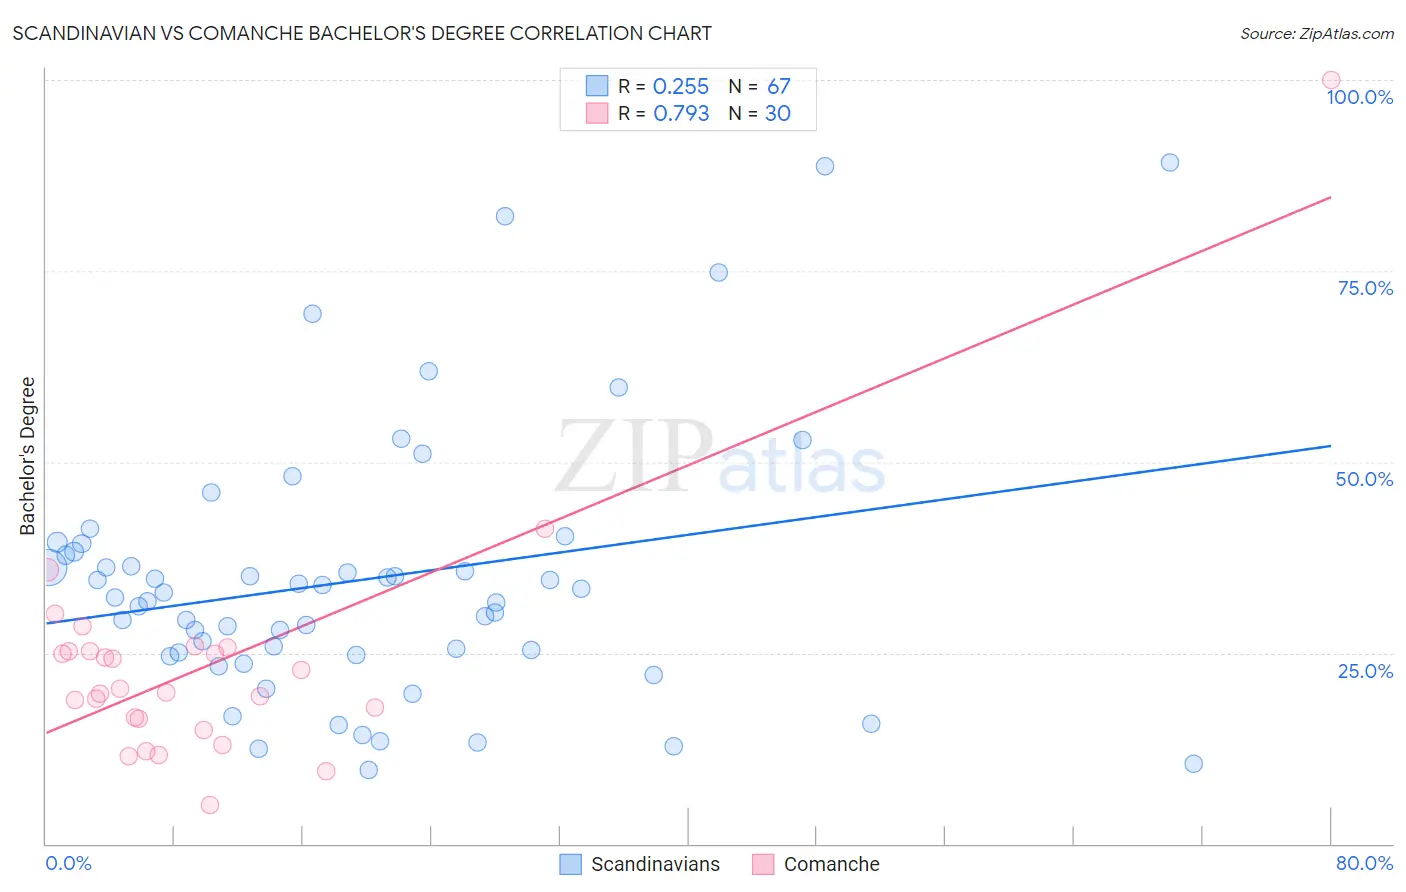
Scandinavian vs Comanche Bachelor's Degree Correlation Chart
The statistical analysis conducted on geographies consisting of 472,607,707 people shows a weak positive correlation between the proportion of Scandinavians and percentage of population with at least bachelor's degree education in the United States with a correlation coefficient (R) of 0.255 and weighted average of 37.5%. Similarly, the statistical analysis conducted on geographies consisting of 109,781,211 people shows a strong positive correlation between the proportion of Comanche and percentage of population with at least bachelor's degree education in the United States with a correlation coefficient (R) of 0.793 and weighted average of 31.9%, a difference of 17.6%.
Bachelor's Degree Correlation Summary
| Measurement | Scandinavian | Comanche |
| Minimum | 9.7% | 5.1% |
| Maximum | 89.2% | 100.0% |
| Range | 79.4% | 94.9% |
| Mean | 34.6% | 23.5% |
| Median | 32.2% | 20.1% |
| Interquartile 25% (IQ1) | 24.7% | 16.4% |
| Interquartile 75% (IQ3) | 38.3% | 25.1% |
| Interquartile Range (IQR) | 13.5% | 8.7% |
| Standard Deviation (Sample) | 17.4% | 16.4% |
| Standard Deviation (Population) | 17.3% | 16.1% |
Similar Demographics by Bachelor's Degree
Demographics Similar to Scandinavians by Bachelor's Degree
In terms of bachelor's degree, the demographic groups most similar to Scandinavians are Senegalese (37.5%, a difference of 0.040%), Immigrants from Peru (37.5%, a difference of 0.040%), Norwegian (37.5%, a difference of 0.14%), Immigrants from Bosnia and Herzegovina (37.6%, a difference of 0.17%), and Immigrants from Senegal (37.6%, a difference of 0.20%).
| Demographics | Rating | Rank | Bachelor's Degree |
| Basques | 47.4 /100 | #177 | Average 37.7% |
| Immigrants | Cameroon | 46.8 /100 | #178 | Average 37.7% |
| Immigrants | Colombia | 45.4 /100 | #179 | Average 37.7% |
| Irish | 44.3 /100 | #180 | Average 37.6% |
| Immigrants | Senegal | 43.8 /100 | #181 | Average 37.6% |
| Immigrants | Bosnia and Herzegovina | 43.4 /100 | #182 | Average 37.6% |
| Senegalese | 42.2 /100 | #183 | Average 37.5% |
| Scandinavians | 41.7 /100 | #184 | Average 37.5% |
| Immigrants | Peru | 41.3 /100 | #185 | Average 37.5% |
| Norwegians | 40.4 /100 | #186 | Average 37.5% |
| English | 39.7 /100 | #187 | Fair 37.4% |
| Immigrants | Oceania | 37.3 /100 | #188 | Fair 37.3% |
| Slovaks | 36.9 /100 | #189 | Fair 37.3% |
| Swiss | 34.1 /100 | #190 | Fair 37.2% |
| Nigerians | 33.9 /100 | #191 | Fair 37.2% |
Demographics Similar to Comanche by Bachelor's Degree
In terms of bachelor's degree, the demographic groups most similar to Comanche are Central American (31.9%, a difference of 0.030%), Immigrants from Nicaragua (31.9%, a difference of 0.12%), American (31.9%, a difference of 0.12%), Potawatomi (31.9%, a difference of 0.14%), and Samoan (31.8%, a difference of 0.27%).
| Demographics | Rating | Rank | Bachelor's Degree |
| Bahamians | 0.3 /100 | #265 | Tragic 32.5% |
| Immigrants | Dominica | 0.3 /100 | #266 | Tragic 32.5% |
| Cubans | 0.3 /100 | #267 | Tragic 32.5% |
| Immigrants | Portugal | 0.2 /100 | #268 | Tragic 32.2% |
| Immigrants | Belize | 0.2 /100 | #269 | Tragic 32.1% |
| Immigrants | Nicaragua | 0.2 /100 | #270 | Tragic 31.9% |
| Central Americans | 0.2 /100 | #271 | Tragic 31.9% |
| Comanche | 0.2 /100 | #272 | Tragic 31.9% |
| Americans | 0.2 /100 | #273 | Tragic 31.9% |
| Potawatomi | 0.2 /100 | #274 | Tragic 31.9% |
| Samoans | 0.1 /100 | #275 | Tragic 31.8% |
| Salvadorans | 0.1 /100 | #276 | Tragic 31.8% |
| Dominicans | 0.1 /100 | #277 | Tragic 31.8% |
| Marshallese | 0.1 /100 | #278 | Tragic 31.7% |
| Hawaiians | 0.1 /100 | #279 | Tragic 31.6% |