Burmese vs Comanche Bachelor's Degree
COMPARE
Burmese
Comanche
Bachelor's Degree
Bachelor's Degree Comparison
Burmese
Comanche
46.9%
BACHELOR'S DEGREE
100.0/ 100
METRIC RATING
25th/ 347
METRIC RANK
31.9%
BACHELOR'S DEGREE
0.2/ 100
METRIC RATING
272nd/ 347
METRIC RANK
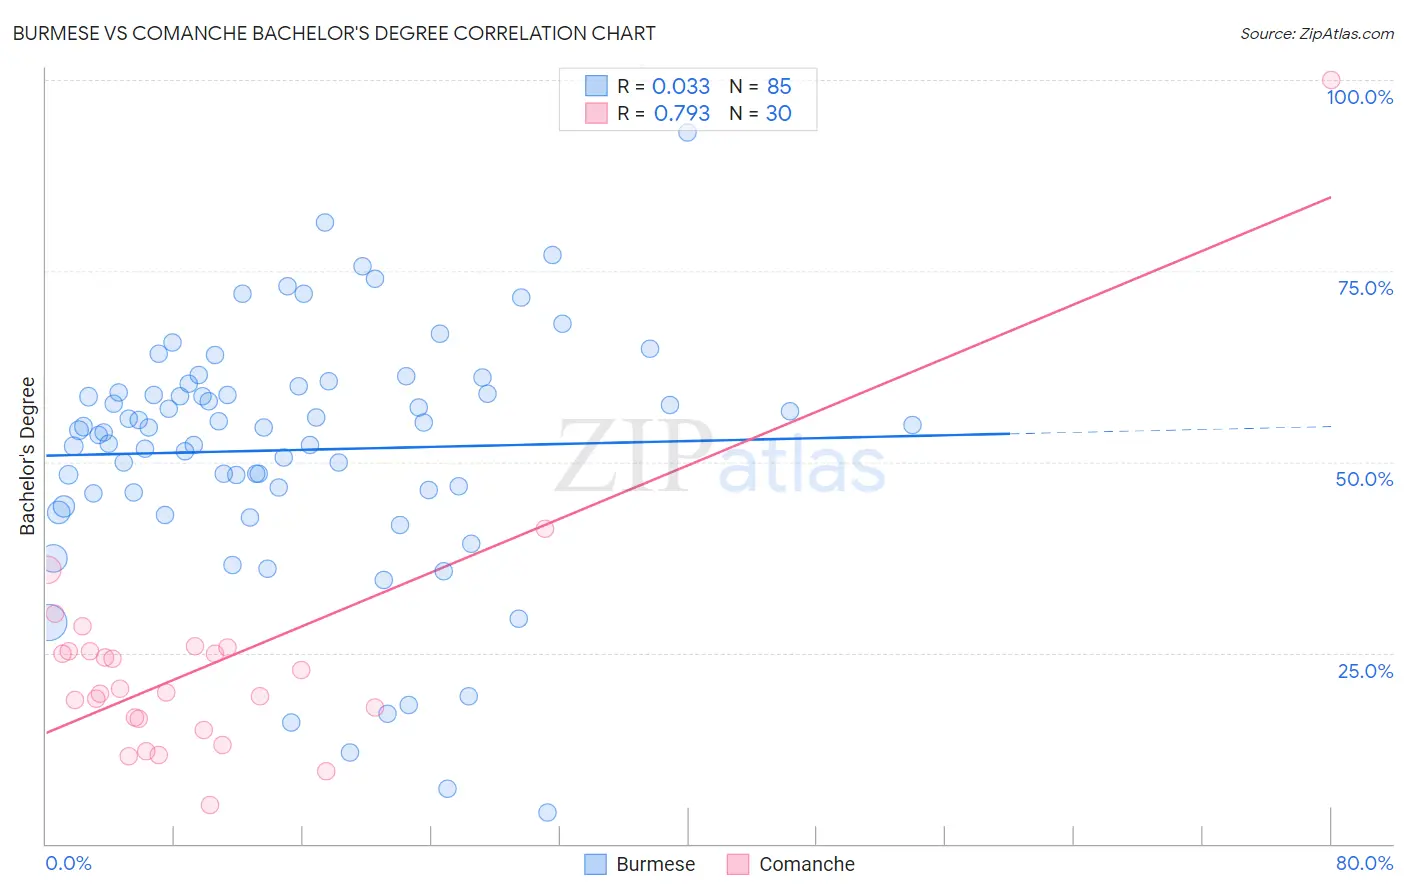
Burmese vs Comanche Bachelor's Degree Correlation Chart
The statistical analysis conducted on geographies consisting of 465,330,560 people shows no correlation between the proportion of Burmese and percentage of population with at least bachelor's degree education in the United States with a correlation coefficient (R) of 0.033 and weighted average of 46.9%. Similarly, the statistical analysis conducted on geographies consisting of 109,781,211 people shows a strong positive correlation between the proportion of Comanche and percentage of population with at least bachelor's degree education in the United States with a correlation coefficient (R) of 0.793 and weighted average of 31.9%, a difference of 46.9%.
Bachelor's Degree Correlation Summary
| Measurement | Burmese | Comanche |
| Minimum | 4.0% | 5.1% |
| Maximum | 93.1% | 100.0% |
| Range | 89.1% | 94.9% |
| Mean | 51.6% | 23.5% |
| Median | 54.4% | 20.1% |
| Interquartile 25% (IQ1) | 45.9% | 16.4% |
| Interquartile 75% (IQ3) | 59.5% | 25.1% |
| Interquartile Range (IQR) | 13.6% | 8.7% |
| Standard Deviation (Sample) | 16.1% | 16.4% |
| Standard Deviation (Population) | 16.0% | 16.1% |
Similar Demographics by Bachelor's Degree
Demographics Similar to Burmese by Bachelor's Degree
In terms of bachelor's degree, the demographic groups most similar to Burmese are Immigrants from Japan (46.8%, a difference of 0.10%), Immigrants from Korea (47.0%, a difference of 0.22%), Immigrants from Sweden (47.0%, a difference of 0.26%), Immigrants from Belgium (47.0%, a difference of 0.35%), and Immigrants from Ireland (47.1%, a difference of 0.55%).
| Demographics | Rating | Rank | Bachelor's Degree |
| Indians (Asian) | 100.0 /100 | #18 | Exceptional 47.4% |
| Cambodians | 100.0 /100 | #19 | Exceptional 47.2% |
| Immigrants | Switzerland | 100.0 /100 | #20 | Exceptional 47.1% |
| Immigrants | Ireland | 100.0 /100 | #21 | Exceptional 47.1% |
| Immigrants | Belgium | 100.0 /100 | #22 | Exceptional 47.0% |
| Immigrants | Sweden | 100.0 /100 | #23 | Exceptional 47.0% |
| Immigrants | Korea | 100.0 /100 | #24 | Exceptional 47.0% |
| Burmese | 100.0 /100 | #25 | Exceptional 46.9% |
| Immigrants | Japan | 100.0 /100 | #26 | Exceptional 46.8% |
| Immigrants | France | 100.0 /100 | #27 | Exceptional 46.4% |
| Turks | 100.0 /100 | #28 | Exceptional 46.2% |
| Israelis | 100.0 /100 | #29 | Exceptional 46.1% |
| Immigrants | Sri Lanka | 100.0 /100 | #30 | Exceptional 46.1% |
| Latvians | 100.0 /100 | #31 | Exceptional 46.1% |
| Immigrants | Turkey | 100.0 /100 | #32 | Exceptional 46.0% |
Demographics Similar to Comanche by Bachelor's Degree
In terms of bachelor's degree, the demographic groups most similar to Comanche are Central American (31.9%, a difference of 0.030%), Immigrants from Nicaragua (31.9%, a difference of 0.12%), American (31.9%, a difference of 0.12%), Potawatomi (31.9%, a difference of 0.14%), and Samoan (31.8%, a difference of 0.27%).
| Demographics | Rating | Rank | Bachelor's Degree |
| Bahamians | 0.3 /100 | #265 | Tragic 32.5% |
| Immigrants | Dominica | 0.3 /100 | #266 | Tragic 32.5% |
| Cubans | 0.3 /100 | #267 | Tragic 32.5% |
| Immigrants | Portugal | 0.2 /100 | #268 | Tragic 32.2% |
| Immigrants | Belize | 0.2 /100 | #269 | Tragic 32.1% |
| Immigrants | Nicaragua | 0.2 /100 | #270 | Tragic 31.9% |
| Central Americans | 0.2 /100 | #271 | Tragic 31.9% |
| Comanche | 0.2 /100 | #272 | Tragic 31.9% |
| Americans | 0.2 /100 | #273 | Tragic 31.9% |
| Potawatomi | 0.2 /100 | #274 | Tragic 31.9% |
| Samoans | 0.1 /100 | #275 | Tragic 31.8% |
| Salvadorans | 0.1 /100 | #276 | Tragic 31.8% |
| Dominicans | 0.1 /100 | #277 | Tragic 31.8% |
| Marshallese | 0.1 /100 | #278 | Tragic 31.7% |
| Hawaiians | 0.1 /100 | #279 | Tragic 31.6% |