Czechoslovakian vs Comanche Bachelor's Degree
COMPARE
Czechoslovakian
Comanche
Bachelor's Degree
Bachelor's Degree Comparison
Czechoslovakians
Comanche
37.0%
BACHELOR'S DEGREE
29.2/ 100
METRIC RATING
197th/ 347
METRIC RANK
31.9%
BACHELOR'S DEGREE
0.2/ 100
METRIC RATING
272nd/ 347
METRIC RANK
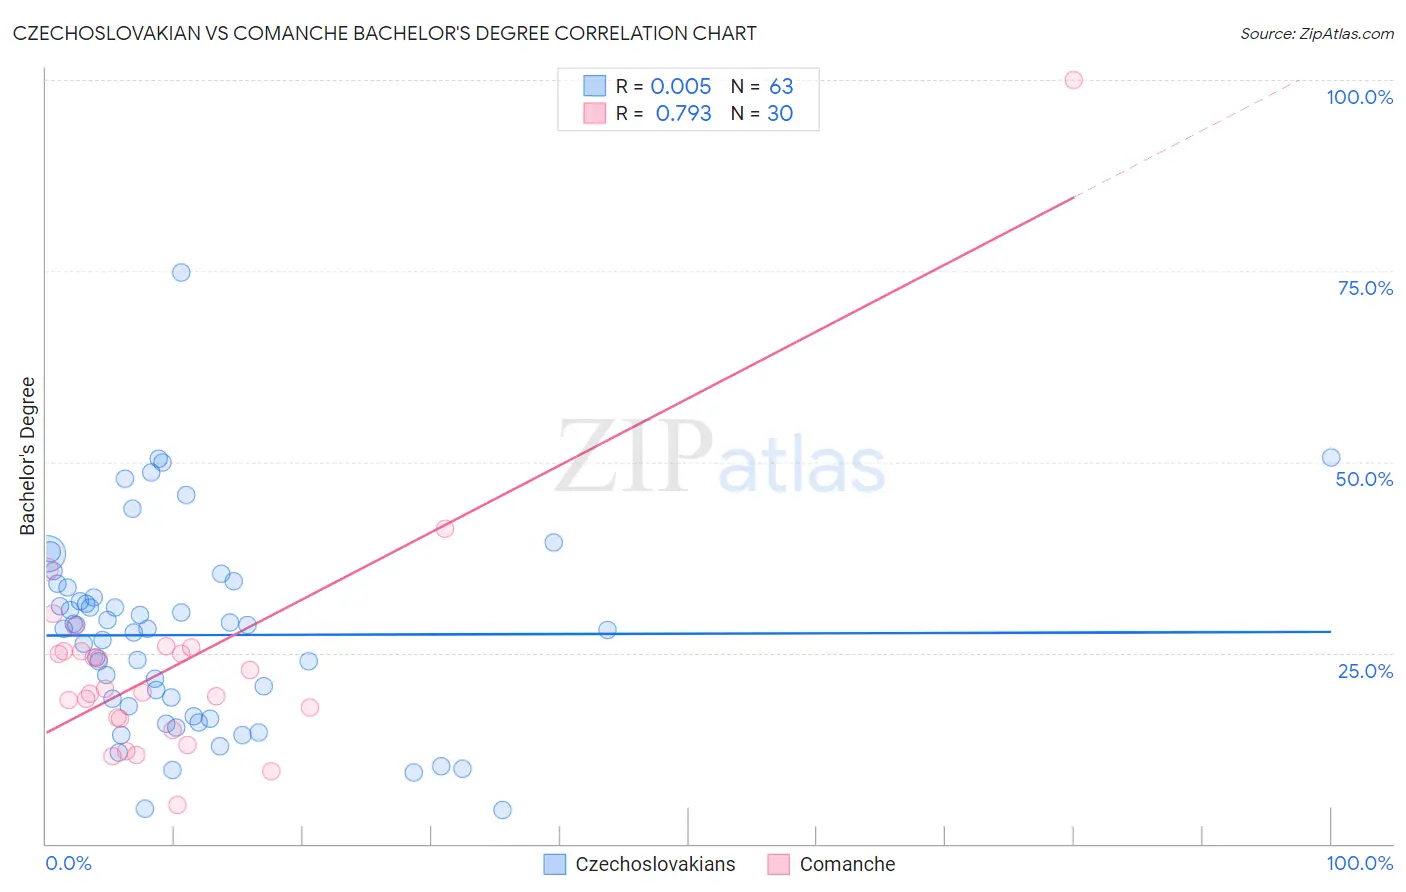
Czechoslovakian vs Comanche Bachelor's Degree Correlation Chart
The statistical analysis conducted on geographies consisting of 368,656,167 people shows no correlation between the proportion of Czechoslovakians and percentage of population with at least bachelor's degree education in the United States with a correlation coefficient (R) of 0.005 and weighted average of 37.0%. Similarly, the statistical analysis conducted on geographies consisting of 109,781,211 people shows a strong positive correlation between the proportion of Comanche and percentage of population with at least bachelor's degree education in the United States with a correlation coefficient (R) of 0.793 and weighted average of 31.9%, a difference of 16.0%.
Bachelor's Degree Correlation Summary
| Measurement | Czechoslovakian | Comanche |
| Minimum | 4.4% | 5.1% |
| Maximum | 74.8% | 100.0% |
| Range | 70.3% | 94.9% |
| Mean | 27.3% | 23.5% |
| Median | 28.1% | 20.1% |
| Interquartile 25% (IQ1) | 16.8% | 16.4% |
| Interquartile 75% (IQ3) | 33.5% | 25.1% |
| Interquartile Range (IQR) | 16.8% | 8.7% |
| Standard Deviation (Sample) | 13.0% | 16.4% |
| Standard Deviation (Population) | 12.9% | 16.1% |
Similar Demographics by Bachelor's Degree
Demographics Similar to Czechoslovakians by Bachelor's Degree
In terms of bachelor's degree, the demographic groups most similar to Czechoslovakians are Welsh (37.0%, a difference of 0.010%), Celtic (37.0%, a difference of 0.040%), Korean (37.0%, a difference of 0.070%), Belgian (37.0%, a difference of 0.090%), and Immigrants from Costa Rica (36.9%, a difference of 0.22%).
| Demographics | Rating | Rank | Bachelor's Degree |
| Swiss | 34.1 /100 | #190 | Fair 37.2% |
| Nigerians | 33.9 /100 | #191 | Fair 37.2% |
| Immigrants | Vietnam | 32.1 /100 | #192 | Fair 37.1% |
| Yugoslavians | 31.5 /100 | #193 | Fair 37.1% |
| Belgians | 29.9 /100 | #194 | Fair 37.0% |
| Koreans | 29.8 /100 | #195 | Fair 37.0% |
| Celtics | 29.5 /100 | #196 | Fair 37.0% |
| Czechoslovakians | 29.2 /100 | #197 | Fair 37.0% |
| Welsh | 29.1 /100 | #198 | Fair 37.0% |
| Immigrants | Costa Rica | 27.4 /100 | #199 | Fair 36.9% |
| Immigrants | Ghana | 27.4 /100 | #200 | Fair 36.9% |
| Immigrants | South Eastern Asia | 25.4 /100 | #201 | Fair 36.8% |
| Immigrants | Zaire | 25.3 /100 | #202 | Fair 36.8% |
| Immigrants | Nigeria | 23.1 /100 | #203 | Fair 36.7% |
| Immigrants | Immigrants | 22.8 /100 | #204 | Fair 36.7% |
Demographics Similar to Comanche by Bachelor's Degree
In terms of bachelor's degree, the demographic groups most similar to Comanche are Central American (31.9%, a difference of 0.030%), Immigrants from Nicaragua (31.9%, a difference of 0.12%), American (31.9%, a difference of 0.12%), Potawatomi (31.9%, a difference of 0.14%), and Samoan (31.8%, a difference of 0.27%).
| Demographics | Rating | Rank | Bachelor's Degree |
| Bahamians | 0.3 /100 | #265 | Tragic 32.5% |
| Immigrants | Dominica | 0.3 /100 | #266 | Tragic 32.5% |
| Cubans | 0.3 /100 | #267 | Tragic 32.5% |
| Immigrants | Portugal | 0.2 /100 | #268 | Tragic 32.2% |
| Immigrants | Belize | 0.2 /100 | #269 | Tragic 32.1% |
| Immigrants | Nicaragua | 0.2 /100 | #270 | Tragic 31.9% |
| Central Americans | 0.2 /100 | #271 | Tragic 31.9% |
| Comanche | 0.2 /100 | #272 | Tragic 31.9% |
| Americans | 0.2 /100 | #273 | Tragic 31.9% |
| Potawatomi | 0.2 /100 | #274 | Tragic 31.9% |
| Samoans | 0.1 /100 | #275 | Tragic 31.8% |
| Salvadorans | 0.1 /100 | #276 | Tragic 31.8% |
| Dominicans | 0.1 /100 | #277 | Tragic 31.8% |
| Marshallese | 0.1 /100 | #278 | Tragic 31.7% |
| Hawaiians | 0.1 /100 | #279 | Tragic 31.6% |