Scandinavian vs Immigrants from Sierra Leone Bachelor's Degree
COMPARE
Scandinavian
Immigrants from Sierra Leone
Bachelor's Degree
Bachelor's Degree Comparison
Scandinavians
Immigrants from Sierra Leone
37.5%
BACHELOR'S DEGREE
41.7/ 100
METRIC RATING
184th/ 347
METRIC RANK
39.0%
BACHELOR'S DEGREE
79.0/ 100
METRIC RATING
147th/ 347
METRIC RANK
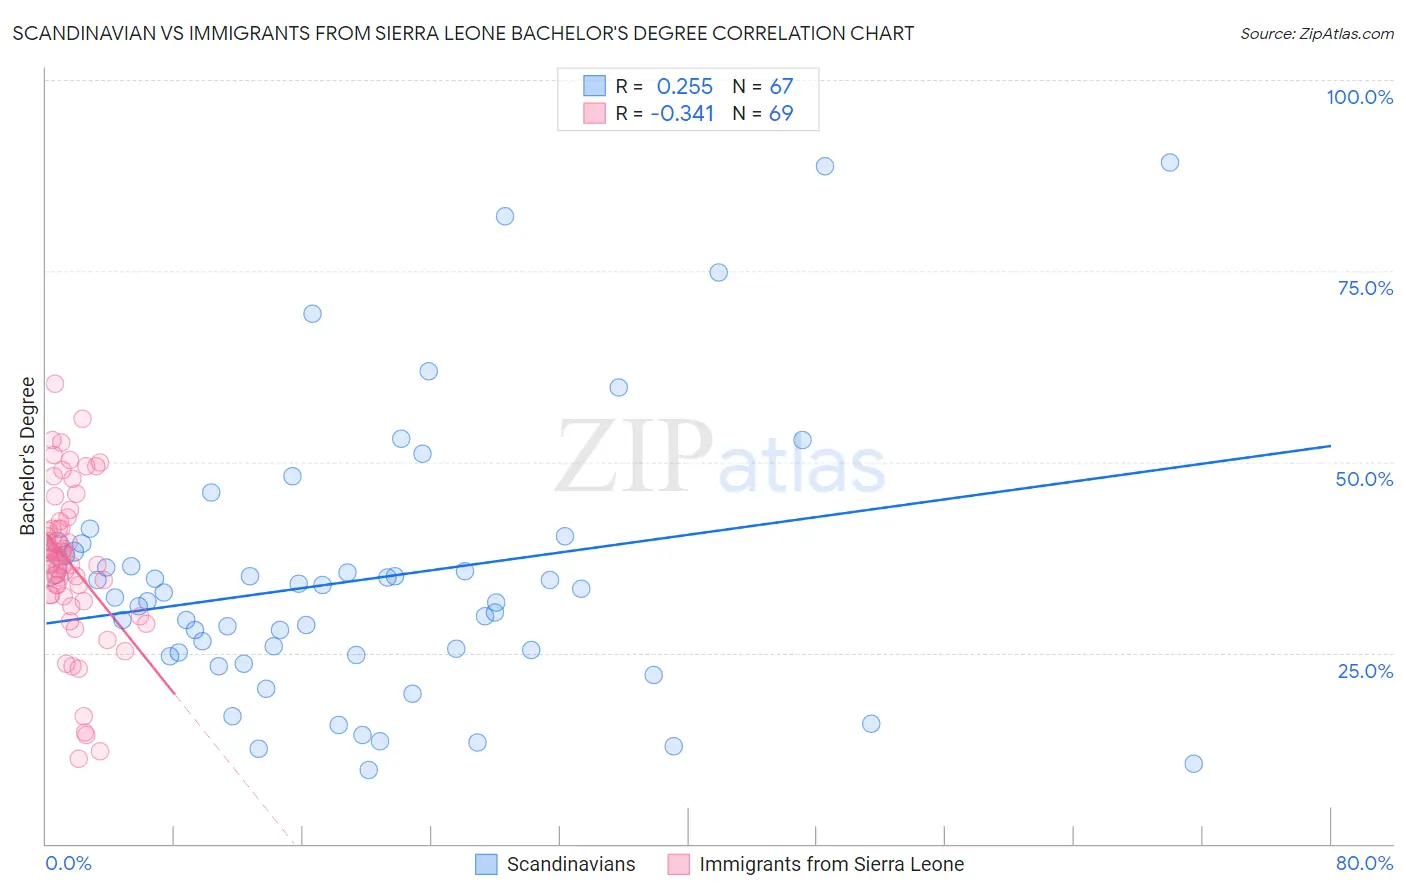
Scandinavian vs Immigrants from Sierra Leone Bachelor's Degree Correlation Chart
The statistical analysis conducted on geographies consisting of 472,607,707 people shows a weak positive correlation between the proportion of Scandinavians and percentage of population with at least bachelor's degree education in the United States with a correlation coefficient (R) of 0.255 and weighted average of 37.5%. Similarly, the statistical analysis conducted on geographies consisting of 101,624,736 people shows a mild negative correlation between the proportion of Immigrants from Sierra Leone and percentage of population with at least bachelor's degree education in the United States with a correlation coefficient (R) of -0.341 and weighted average of 39.0%, a difference of 4.1%.
Bachelor's Degree Correlation Summary
| Measurement | Scandinavian | Immigrants from Sierra Leone |
| Minimum | 9.7% | 11.2% |
| Maximum | 89.2% | 60.2% |
| Range | 79.4% | 49.0% |
| Mean | 34.6% | 36.8% |
| Median | 32.2% | 37.5% |
| Interquartile 25% (IQ1) | 24.7% | 32.5% |
| Interquartile 75% (IQ3) | 38.3% | 41.7% |
| Interquartile Range (IQR) | 13.5% | 9.2% |
| Standard Deviation (Sample) | 17.4% | 10.1% |
| Standard Deviation (Population) | 17.3% | 10.0% |
Similar Demographics by Bachelor's Degree
Demographics Similar to Scandinavians by Bachelor's Degree
In terms of bachelor's degree, the demographic groups most similar to Scandinavians are Senegalese (37.5%, a difference of 0.040%), Immigrants from Peru (37.5%, a difference of 0.040%), Norwegian (37.5%, a difference of 0.14%), Immigrants from Bosnia and Herzegovina (37.6%, a difference of 0.17%), and Immigrants from Senegal (37.6%, a difference of 0.20%).
| Demographics | Rating | Rank | Bachelor's Degree |
| Basques | 47.4 /100 | #177 | Average 37.7% |
| Immigrants | Cameroon | 46.8 /100 | #178 | Average 37.7% |
| Immigrants | Colombia | 45.4 /100 | #179 | Average 37.7% |
| Irish | 44.3 /100 | #180 | Average 37.6% |
| Immigrants | Senegal | 43.8 /100 | #181 | Average 37.6% |
| Immigrants | Bosnia and Herzegovina | 43.4 /100 | #182 | Average 37.6% |
| Senegalese | 42.2 /100 | #183 | Average 37.5% |
| Scandinavians | 41.7 /100 | #184 | Average 37.5% |
| Immigrants | Peru | 41.3 /100 | #185 | Average 37.5% |
| Norwegians | 40.4 /100 | #186 | Average 37.5% |
| English | 39.7 /100 | #187 | Fair 37.4% |
| Immigrants | Oceania | 37.3 /100 | #188 | Fair 37.3% |
| Slovaks | 36.9 /100 | #189 | Fair 37.3% |
| Swiss | 34.1 /100 | #190 | Fair 37.2% |
| Nigerians | 33.9 /100 | #191 | Fair 37.2% |
Demographics Similar to Immigrants from Sierra Leone by Bachelor's Degree
In terms of bachelor's degree, the demographic groups most similar to Immigrants from Sierra Leone are Swedish (39.1%, a difference of 0.030%), Slovene (39.1%, a difference of 0.070%), Immigrants from Afghanistan (39.1%, a difference of 0.10%), Polish (39.1%, a difference of 0.12%), and Iraqi (39.0%, a difference of 0.14%).
| Demographics | Rating | Rank | Bachelor's Degree |
| Immigrants | Armenia | 84.1 /100 | #140 | Excellent 39.4% |
| South American Indians | 83.6 /100 | #141 | Excellent 39.3% |
| Immigrants | North Macedonia | 81.6 /100 | #142 | Excellent 39.2% |
| Poles | 79.8 /100 | #143 | Good 39.1% |
| Immigrants | Afghanistan | 79.7 /100 | #144 | Good 39.1% |
| Slovenes | 79.5 /100 | #145 | Good 39.1% |
| Swedes | 79.2 /100 | #146 | Good 39.1% |
| Immigrants | Sierra Leone | 79.0 /100 | #147 | Good 39.0% |
| Iraqis | 78.1 /100 | #148 | Good 39.0% |
| Immigrants | Poland | 77.5 /100 | #149 | Good 39.0% |
| South Americans | 77.3 /100 | #150 | Good 38.9% |
| Immigrants | Africa | 76.5 /100 | #151 | Good 38.9% |
| Sudanese | 76.4 /100 | #152 | Good 38.9% |
| Slavs | 75.9 /100 | #153 | Good 38.9% |
| Canadians | 75.0 /100 | #154 | Good 38.8% |