Chippewa vs Comanche Bachelor's Degree
COMPARE
Chippewa
Comanche
Bachelor's Degree
Bachelor's Degree Comparison
Chippewa
Comanche
30.6%
BACHELOR'S DEGREE
0.0/ 100
METRIC RATING
298th/ 347
METRIC RANK
31.9%
BACHELOR'S DEGREE
0.2/ 100
METRIC RATING
272nd/ 347
METRIC RANK
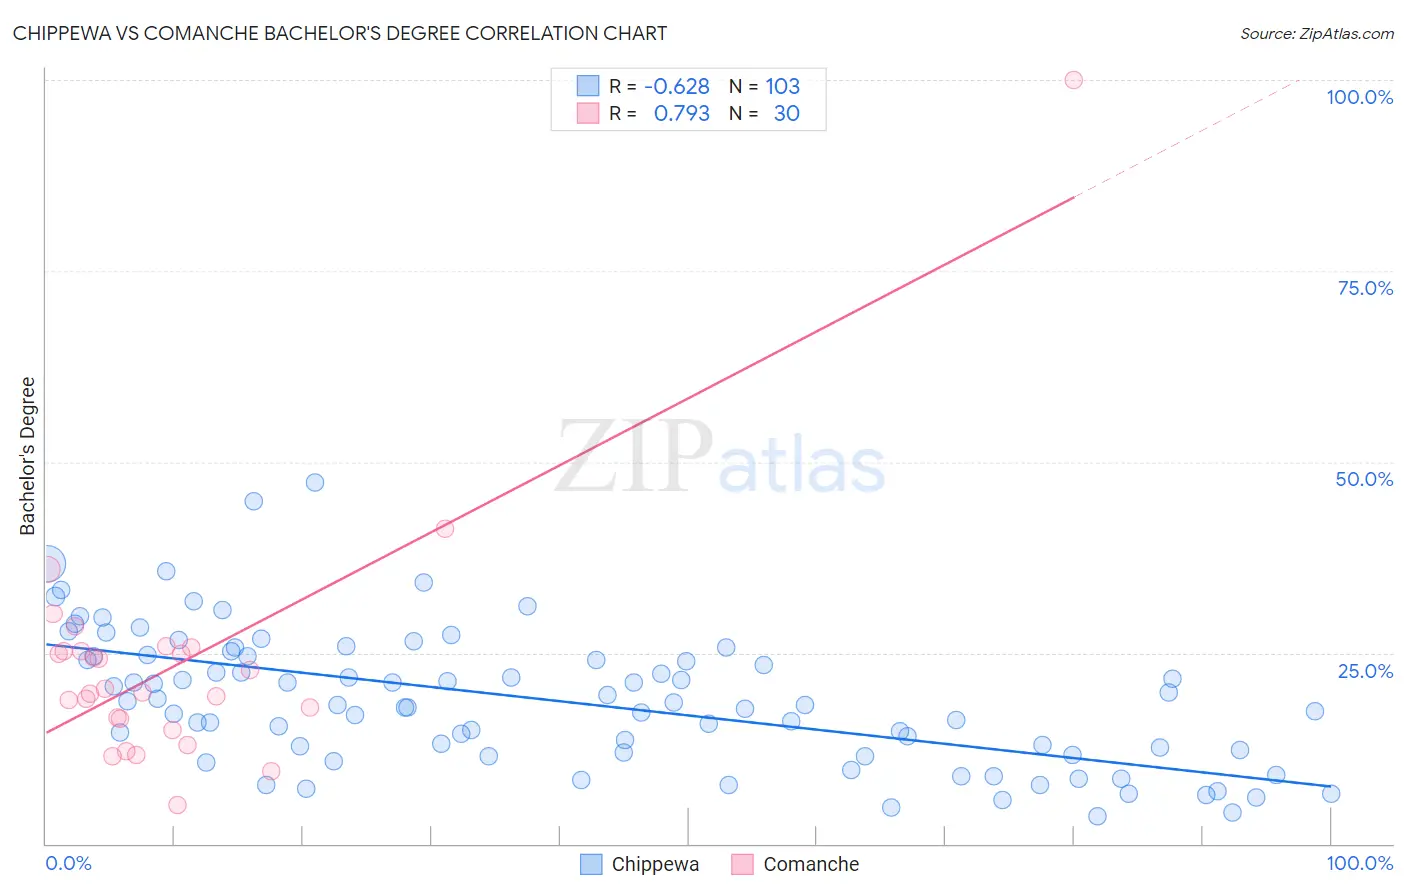
Chippewa vs Comanche Bachelor's Degree Correlation Chart
The statistical analysis conducted on geographies consisting of 215,055,774 people shows a significant negative correlation between the proportion of Chippewa and percentage of population with at least bachelor's degree education in the United States with a correlation coefficient (R) of -0.628 and weighted average of 30.6%. Similarly, the statistical analysis conducted on geographies consisting of 109,781,211 people shows a strong positive correlation between the proportion of Comanche and percentage of population with at least bachelor's degree education in the United States with a correlation coefficient (R) of 0.793 and weighted average of 31.9%, a difference of 4.4%.
Bachelor's Degree Correlation Summary
| Measurement | Chippewa | Comanche |
| Minimum | 3.6% | 5.1% |
| Maximum | 47.3% | 100.0% |
| Range | 43.7% | 94.9% |
| Mean | 18.8% | 23.5% |
| Median | 18.2% | 20.1% |
| Interquartile 25% (IQ1) | 12.0% | 16.4% |
| Interquartile 75% (IQ3) | 24.6% | 25.1% |
| Interquartile Range (IQR) | 12.6% | 8.7% |
| Standard Deviation (Sample) | 8.9% | 16.4% |
| Standard Deviation (Population) | 8.8% | 16.1% |
Similar Demographics by Bachelor's Degree
Demographics Similar to Chippewa by Bachelor's Degree
In terms of bachelor's degree, the demographic groups most similar to Chippewa are Immigrants from Haiti (30.6%, a difference of 0.25%), Puget Sound Salish (30.7%, a difference of 0.31%), Immigrants from Dominican Republic (30.7%, a difference of 0.41%), Chickasaw (30.4%, a difference of 0.52%), and Immigrants from Micronesia (30.4%, a difference of 0.54%).
| Demographics | Rating | Rank | Bachelor's Degree |
| Blacks/African Americans | 0.1 /100 | #291 | Tragic 30.9% |
| Ute | 0.1 /100 | #292 | Tragic 30.9% |
| Cape Verdeans | 0.1 /100 | #293 | Tragic 30.9% |
| Immigrants | Guatemala | 0.0 /100 | #294 | Tragic 30.8% |
| Immigrants | Dominican Republic | 0.0 /100 | #295 | Tragic 30.7% |
| Puget Sound Salish | 0.0 /100 | #296 | Tragic 30.7% |
| Immigrants | Haiti | 0.0 /100 | #297 | Tragic 30.6% |
| Chippewa | 0.0 /100 | #298 | Tragic 30.6% |
| Chickasaw | 0.0 /100 | #299 | Tragic 30.4% |
| Immigrants | Micronesia | 0.0 /100 | #300 | Tragic 30.4% |
| Immigrants | Cuba | 0.0 /100 | #301 | Tragic 30.3% |
| Mexican American Indians | 0.0 /100 | #302 | Tragic 30.2% |
| Bangladeshis | 0.0 /100 | #303 | Tragic 30.2% |
| Cherokee | 0.0 /100 | #304 | Tragic 30.2% |
| Immigrants | Latin America | 0.0 /100 | #305 | Tragic 30.1% |
Demographics Similar to Comanche by Bachelor's Degree
In terms of bachelor's degree, the demographic groups most similar to Comanche are Central American (31.9%, a difference of 0.030%), Immigrants from Nicaragua (31.9%, a difference of 0.12%), American (31.9%, a difference of 0.12%), Potawatomi (31.9%, a difference of 0.14%), and Samoan (31.8%, a difference of 0.27%).
| Demographics | Rating | Rank | Bachelor's Degree |
| Bahamians | 0.3 /100 | #265 | Tragic 32.5% |
| Immigrants | Dominica | 0.3 /100 | #266 | Tragic 32.5% |
| Cubans | 0.3 /100 | #267 | Tragic 32.5% |
| Immigrants | Portugal | 0.2 /100 | #268 | Tragic 32.2% |
| Immigrants | Belize | 0.2 /100 | #269 | Tragic 32.1% |
| Immigrants | Nicaragua | 0.2 /100 | #270 | Tragic 31.9% |
| Central Americans | 0.2 /100 | #271 | Tragic 31.9% |
| Comanche | 0.2 /100 | #272 | Tragic 31.9% |
| Americans | 0.2 /100 | #273 | Tragic 31.9% |
| Potawatomi | 0.2 /100 | #274 | Tragic 31.9% |
| Samoans | 0.1 /100 | #275 | Tragic 31.8% |
| Salvadorans | 0.1 /100 | #276 | Tragic 31.8% |
| Dominicans | 0.1 /100 | #277 | Tragic 31.8% |
| Marshallese | 0.1 /100 | #278 | Tragic 31.7% |
| Hawaiians | 0.1 /100 | #279 | Tragic 31.6% |