Scandinavian vs Immigrants from Austria Bachelor's Degree
COMPARE
Scandinavian
Immigrants from Austria
Bachelor's Degree
Bachelor's Degree Comparison
Scandinavians
Immigrants from Austria
37.5%
BACHELOR'S DEGREE
41.7/ 100
METRIC RATING
184th/ 347
METRIC RANK
44.2%
BACHELOR'S DEGREE
99.9/ 100
METRIC RATING
54th/ 347
METRIC RANK
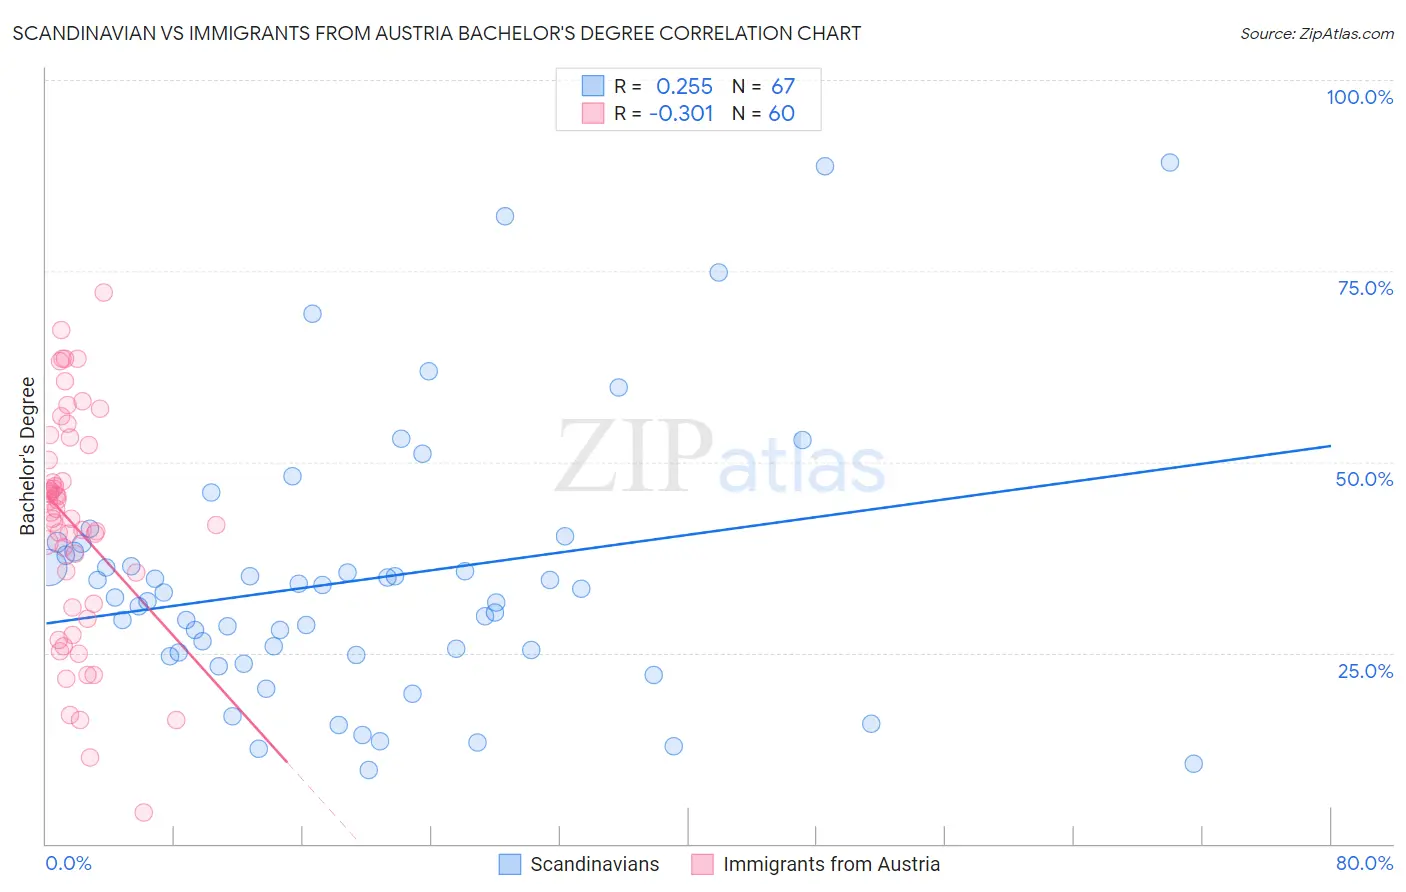
Scandinavian vs Immigrants from Austria Bachelor's Degree Correlation Chart
The statistical analysis conducted on geographies consisting of 472,607,707 people shows a weak positive correlation between the proportion of Scandinavians and percentage of population with at least bachelor's degree education in the United States with a correlation coefficient (R) of 0.255 and weighted average of 37.5%. Similarly, the statistical analysis conducted on geographies consisting of 167,971,732 people shows a mild negative correlation between the proportion of Immigrants from Austria and percentage of population with at least bachelor's degree education in the United States with a correlation coefficient (R) of -0.301 and weighted average of 44.2%, a difference of 17.8%.
Bachelor's Degree Correlation Summary
| Measurement | Scandinavian | Immigrants from Austria |
| Minimum | 9.7% | 4.1% |
| Maximum | 89.2% | 72.2% |
| Range | 79.4% | 68.1% |
| Mean | 34.6% | 41.7% |
| Median | 32.2% | 43.0% |
| Interquartile 25% (IQ1) | 24.7% | 31.2% |
| Interquartile 75% (IQ3) | 38.3% | 51.2% |
| Interquartile Range (IQR) | 13.5% | 20.0% |
| Standard Deviation (Sample) | 17.4% | 14.7% |
| Standard Deviation (Population) | 17.3% | 14.6% |
Similar Demographics by Bachelor's Degree
Demographics Similar to Scandinavians by Bachelor's Degree
In terms of bachelor's degree, the demographic groups most similar to Scandinavians are Senegalese (37.5%, a difference of 0.040%), Immigrants from Peru (37.5%, a difference of 0.040%), Norwegian (37.5%, a difference of 0.14%), Immigrants from Bosnia and Herzegovina (37.6%, a difference of 0.17%), and Immigrants from Senegal (37.6%, a difference of 0.20%).
| Demographics | Rating | Rank | Bachelor's Degree |
| Basques | 47.4 /100 | #177 | Average 37.7% |
| Immigrants | Cameroon | 46.8 /100 | #178 | Average 37.7% |
| Immigrants | Colombia | 45.4 /100 | #179 | Average 37.7% |
| Irish | 44.3 /100 | #180 | Average 37.6% |
| Immigrants | Senegal | 43.8 /100 | #181 | Average 37.6% |
| Immigrants | Bosnia and Herzegovina | 43.4 /100 | #182 | Average 37.6% |
| Senegalese | 42.2 /100 | #183 | Average 37.5% |
| Scandinavians | 41.7 /100 | #184 | Average 37.5% |
| Immigrants | Peru | 41.3 /100 | #185 | Average 37.5% |
| Norwegians | 40.4 /100 | #186 | Average 37.5% |
| English | 39.7 /100 | #187 | Fair 37.4% |
| Immigrants | Oceania | 37.3 /100 | #188 | Fair 37.3% |
| Slovaks | 36.9 /100 | #189 | Fair 37.3% |
| Swiss | 34.1 /100 | #190 | Fair 37.2% |
| Nigerians | 33.9 /100 | #191 | Fair 37.2% |
Demographics Similar to Immigrants from Austria by Bachelor's Degree
In terms of bachelor's degree, the demographic groups most similar to Immigrants from Austria are Immigrants from Bolivia (44.2%, a difference of 0.0%), Immigrants from Asia (44.3%, a difference of 0.19%), Immigrants from Serbia (44.1%, a difference of 0.19%), Immigrants from Spain (44.3%, a difference of 0.24%), and Paraguayan (44.0%, a difference of 0.37%).
| Demographics | Rating | Rank | Bachelor's Degree |
| Bolivians | 99.9 /100 | #47 | Exceptional 44.6% |
| Estonians | 99.9 /100 | #48 | Exceptional 44.6% |
| Immigrants | Norway | 99.9 /100 | #49 | Exceptional 44.5% |
| Immigrants | Greece | 99.9 /100 | #50 | Exceptional 44.5% |
| Asians | 99.9 /100 | #51 | Exceptional 44.4% |
| Immigrants | Spain | 99.9 /100 | #52 | Exceptional 44.3% |
| Immigrants | Asia | 99.9 /100 | #53 | Exceptional 44.3% |
| Immigrants | Austria | 99.9 /100 | #54 | Exceptional 44.2% |
| Immigrants | Bolivia | 99.9 /100 | #55 | Exceptional 44.2% |
| Immigrants | Serbia | 99.9 /100 | #56 | Exceptional 44.1% |
| Paraguayans | 99.9 /100 | #57 | Exceptional 44.0% |
| Immigrants | Czechoslovakia | 99.9 /100 | #58 | Exceptional 44.0% |
| Australians | 99.9 /100 | #59 | Exceptional 44.0% |
| New Zealanders | 99.9 /100 | #60 | Exceptional 44.0% |
| South Africans | 99.8 /100 | #61 | Exceptional 43.6% |