Cambodian vs Comanche Bachelor's Degree
COMPARE
Cambodian
Comanche
Bachelor's Degree
Bachelor's Degree Comparison
Cambodians
Comanche
47.2%
BACHELOR'S DEGREE
100.0/ 100
METRIC RATING
19th/ 347
METRIC RANK
31.9%
BACHELOR'S DEGREE
0.2/ 100
METRIC RATING
272nd/ 347
METRIC RANK
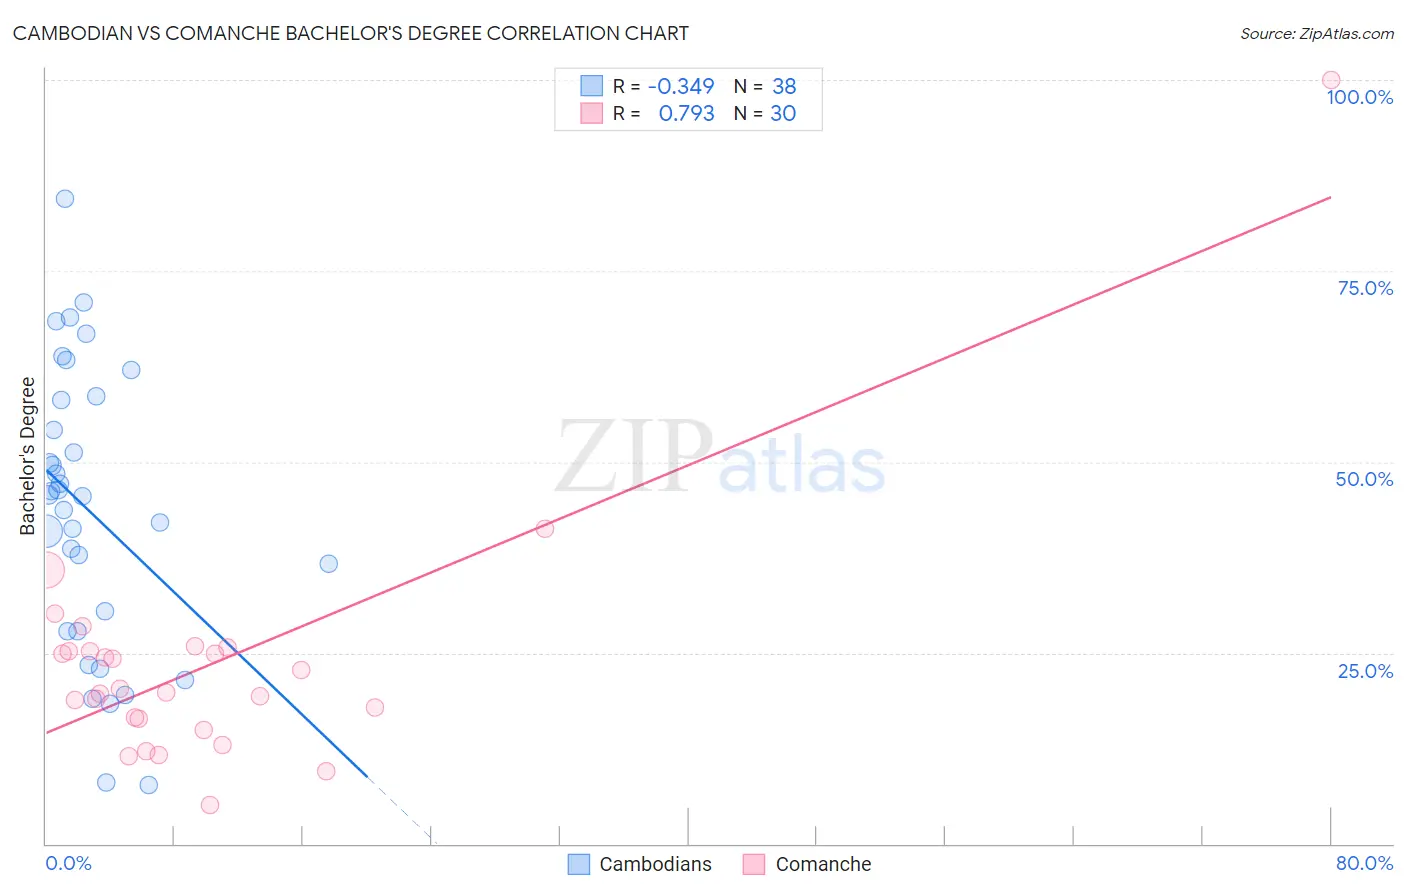
Cambodian vs Comanche Bachelor's Degree Correlation Chart
The statistical analysis conducted on geographies consisting of 102,512,775 people shows a mild negative correlation between the proportion of Cambodians and percentage of population with at least bachelor's degree education in the United States with a correlation coefficient (R) of -0.349 and weighted average of 47.2%. Similarly, the statistical analysis conducted on geographies consisting of 109,781,211 people shows a strong positive correlation between the proportion of Comanche and percentage of population with at least bachelor's degree education in the United States with a correlation coefficient (R) of 0.793 and weighted average of 31.9%, a difference of 48.1%.
Bachelor's Degree Correlation Summary
| Measurement | Cambodian | Comanche |
| Minimum | 7.6% | 5.1% |
| Maximum | 84.4% | 100.0% |
| Range | 76.8% | 94.9% |
| Mean | 43.6% | 23.5% |
| Median | 45.6% | 20.1% |
| Interquartile 25% (IQ1) | 27.8% | 16.4% |
| Interquartile 75% (IQ3) | 58.1% | 25.1% |
| Interquartile Range (IQR) | 30.3% | 8.7% |
| Standard Deviation (Sample) | 18.4% | 16.4% |
| Standard Deviation (Population) | 18.2% | 16.1% |
Similar Demographics by Bachelor's Degree
Demographics Similar to Cambodians by Bachelor's Degree
In terms of bachelor's degree, the demographic groups most similar to Cambodians are Immigrants from Switzerland (47.1%, a difference of 0.22%), Immigrants from Ireland (47.1%, a difference of 0.23%), Indian (Asian) (47.4%, a difference of 0.43%), Immigrants from Belgium (47.0%, a difference of 0.43%), and Immigrants from Sweden (47.0%, a difference of 0.52%).
| Demographics | Rating | Rank | Bachelor's Degree |
| Immigrants | China | 100.0 /100 | #12 | Exceptional 48.4% |
| Immigrants | South Central Asia | 100.0 /100 | #13 | Exceptional 48.3% |
| Immigrants | Hong Kong | 100.0 /100 | #14 | Exceptional 48.2% |
| Immigrants | Eastern Asia | 100.0 /100 | #15 | Exceptional 48.1% |
| Soviet Union | 100.0 /100 | #16 | Exceptional 47.9% |
| Eastern Europeans | 100.0 /100 | #17 | Exceptional 47.5% |
| Indians (Asian) | 100.0 /100 | #18 | Exceptional 47.4% |
| Cambodians | 100.0 /100 | #19 | Exceptional 47.2% |
| Immigrants | Switzerland | 100.0 /100 | #20 | Exceptional 47.1% |
| Immigrants | Ireland | 100.0 /100 | #21 | Exceptional 47.1% |
| Immigrants | Belgium | 100.0 /100 | #22 | Exceptional 47.0% |
| Immigrants | Sweden | 100.0 /100 | #23 | Exceptional 47.0% |
| Immigrants | Korea | 100.0 /100 | #24 | Exceptional 47.0% |
| Burmese | 100.0 /100 | #25 | Exceptional 46.9% |
| Immigrants | Japan | 100.0 /100 | #26 | Exceptional 46.8% |
Demographics Similar to Comanche by Bachelor's Degree
In terms of bachelor's degree, the demographic groups most similar to Comanche are Central American (31.9%, a difference of 0.030%), Immigrants from Nicaragua (31.9%, a difference of 0.12%), American (31.9%, a difference of 0.12%), Potawatomi (31.9%, a difference of 0.14%), and Samoan (31.8%, a difference of 0.27%).
| Demographics | Rating | Rank | Bachelor's Degree |
| Bahamians | 0.3 /100 | #265 | Tragic 32.5% |
| Immigrants | Dominica | 0.3 /100 | #266 | Tragic 32.5% |
| Cubans | 0.3 /100 | #267 | Tragic 32.5% |
| Immigrants | Portugal | 0.2 /100 | #268 | Tragic 32.2% |
| Immigrants | Belize | 0.2 /100 | #269 | Tragic 32.1% |
| Immigrants | Nicaragua | 0.2 /100 | #270 | Tragic 31.9% |
| Central Americans | 0.2 /100 | #271 | Tragic 31.9% |
| Comanche | 0.2 /100 | #272 | Tragic 31.9% |
| Americans | 0.2 /100 | #273 | Tragic 31.9% |
| Potawatomi | 0.2 /100 | #274 | Tragic 31.9% |
| Samoans | 0.1 /100 | #275 | Tragic 31.8% |
| Salvadorans | 0.1 /100 | #276 | Tragic 31.8% |
| Dominicans | 0.1 /100 | #277 | Tragic 31.8% |
| Marshallese | 0.1 /100 | #278 | Tragic 31.7% |
| Hawaiians | 0.1 /100 | #279 | Tragic 31.6% |