Scandinavian vs Black/African American Bachelor's Degree
COMPARE
Scandinavian
Black/African American
Bachelor's Degree
Bachelor's Degree Comparison
Scandinavians
Blacks/African Americans
37.5%
BACHELOR'S DEGREE
41.7/ 100
METRIC RATING
184th/ 347
METRIC RANK
30.9%
BACHELOR'S DEGREE
0.1/ 100
METRIC RATING
291st/ 347
METRIC RANK
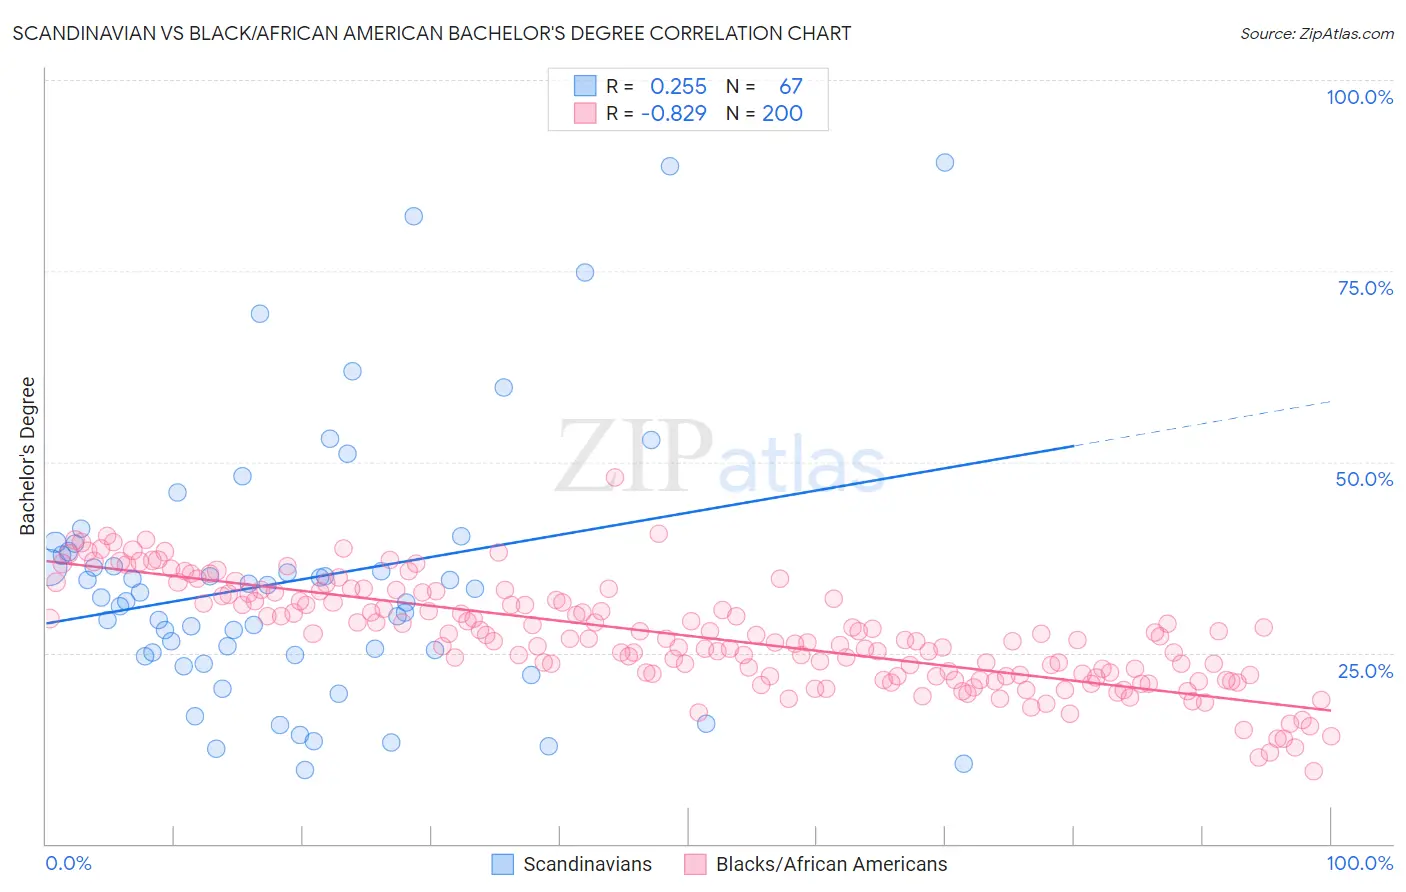
Scandinavian vs Black/African American Bachelor's Degree Correlation Chart
The statistical analysis conducted on geographies consisting of 472,607,707 people shows a weak positive correlation between the proportion of Scandinavians and percentage of population with at least bachelor's degree education in the United States with a correlation coefficient (R) of 0.255 and weighted average of 37.5%. Similarly, the statistical analysis conducted on geographies consisting of 565,857,967 people shows a very strong negative correlation between the proportion of Blacks/African Americans and percentage of population with at least bachelor's degree education in the United States with a correlation coefficient (R) of -0.829 and weighted average of 30.9%, a difference of 21.3%.
Bachelor's Degree Correlation Summary
| Measurement | Scandinavian | Black/African American |
| Minimum | 9.7% | 9.5% |
| Maximum | 89.2% | 47.9% |
| Range | 79.4% | 38.4% |
| Mean | 34.6% | 27.2% |
| Median | 32.2% | 26.9% |
| Interquartile 25% (IQ1) | 24.7% | 22.0% |
| Interquartile 75% (IQ3) | 38.3% | 32.3% |
| Interquartile Range (IQR) | 13.5% | 10.3% |
| Standard Deviation (Sample) | 17.4% | 6.8% |
| Standard Deviation (Population) | 17.3% | 6.8% |
Similar Demographics by Bachelor's Degree
Demographics Similar to Scandinavians by Bachelor's Degree
In terms of bachelor's degree, the demographic groups most similar to Scandinavians are Senegalese (37.5%, a difference of 0.040%), Immigrants from Peru (37.5%, a difference of 0.040%), Norwegian (37.5%, a difference of 0.14%), Immigrants from Bosnia and Herzegovina (37.6%, a difference of 0.17%), and Immigrants from Senegal (37.6%, a difference of 0.20%).
| Demographics | Rating | Rank | Bachelor's Degree |
| Basques | 47.4 /100 | #177 | Average 37.7% |
| Immigrants | Cameroon | 46.8 /100 | #178 | Average 37.7% |
| Immigrants | Colombia | 45.4 /100 | #179 | Average 37.7% |
| Irish | 44.3 /100 | #180 | Average 37.6% |
| Immigrants | Senegal | 43.8 /100 | #181 | Average 37.6% |
| Immigrants | Bosnia and Herzegovina | 43.4 /100 | #182 | Average 37.6% |
| Senegalese | 42.2 /100 | #183 | Average 37.5% |
| Scandinavians | 41.7 /100 | #184 | Average 37.5% |
| Immigrants | Peru | 41.3 /100 | #185 | Average 37.5% |
| Norwegians | 40.4 /100 | #186 | Average 37.5% |
| English | 39.7 /100 | #187 | Fair 37.4% |
| Immigrants | Oceania | 37.3 /100 | #188 | Fair 37.3% |
| Slovaks | 36.9 /100 | #189 | Fair 37.3% |
| Swiss | 34.1 /100 | #190 | Fair 37.2% |
| Nigerians | 33.9 /100 | #191 | Fair 37.2% |
Demographics Similar to Blacks/African Americans by Bachelor's Degree
In terms of bachelor's degree, the demographic groups most similar to Blacks/African Americans are Immigrants from Honduras (30.9%, a difference of 0.040%), Puerto Rican (31.0%, a difference of 0.080%), Ute (30.9%, a difference of 0.080%), Cape Verdean (30.9%, a difference of 0.18%), and Guatemalan (31.0%, a difference of 0.22%).
| Demographics | Rating | Rank | Bachelor's Degree |
| Haitians | 0.1 /100 | #284 | Tragic 31.3% |
| Aleuts | 0.1 /100 | #285 | Tragic 31.3% |
| Immigrants | El Salvador | 0.1 /100 | #286 | Tragic 31.3% |
| Ottawa | 0.1 /100 | #287 | Tragic 31.1% |
| Guatemalans | 0.1 /100 | #288 | Tragic 31.0% |
| Puerto Ricans | 0.1 /100 | #289 | Tragic 31.0% |
| Immigrants | Honduras | 0.1 /100 | #290 | Tragic 30.9% |
| Blacks/African Americans | 0.1 /100 | #291 | Tragic 30.9% |
| Ute | 0.1 /100 | #292 | Tragic 30.9% |
| Cape Verdeans | 0.1 /100 | #293 | Tragic 30.9% |
| Immigrants | Guatemala | 0.0 /100 | #294 | Tragic 30.8% |
| Immigrants | Dominican Republic | 0.0 /100 | #295 | Tragic 30.7% |
| Puget Sound Salish | 0.0 /100 | #296 | Tragic 30.7% |
| Immigrants | Haiti | 0.0 /100 | #297 | Tragic 30.6% |
| Chippewa | 0.0 /100 | #298 | Tragic 30.6% |