Scandinavian vs Immigrants from Europe Bachelor's Degree
COMPARE
Scandinavian
Immigrants from Europe
Bachelor's Degree
Bachelor's Degree Comparison
Scandinavians
Immigrants from Europe
37.5%
BACHELOR'S DEGREE
41.7/ 100
METRIC RATING
184th/ 347
METRIC RANK
43.4%
BACHELOR'S DEGREE
99.8/ 100
METRIC RATING
63rd/ 347
METRIC RANK
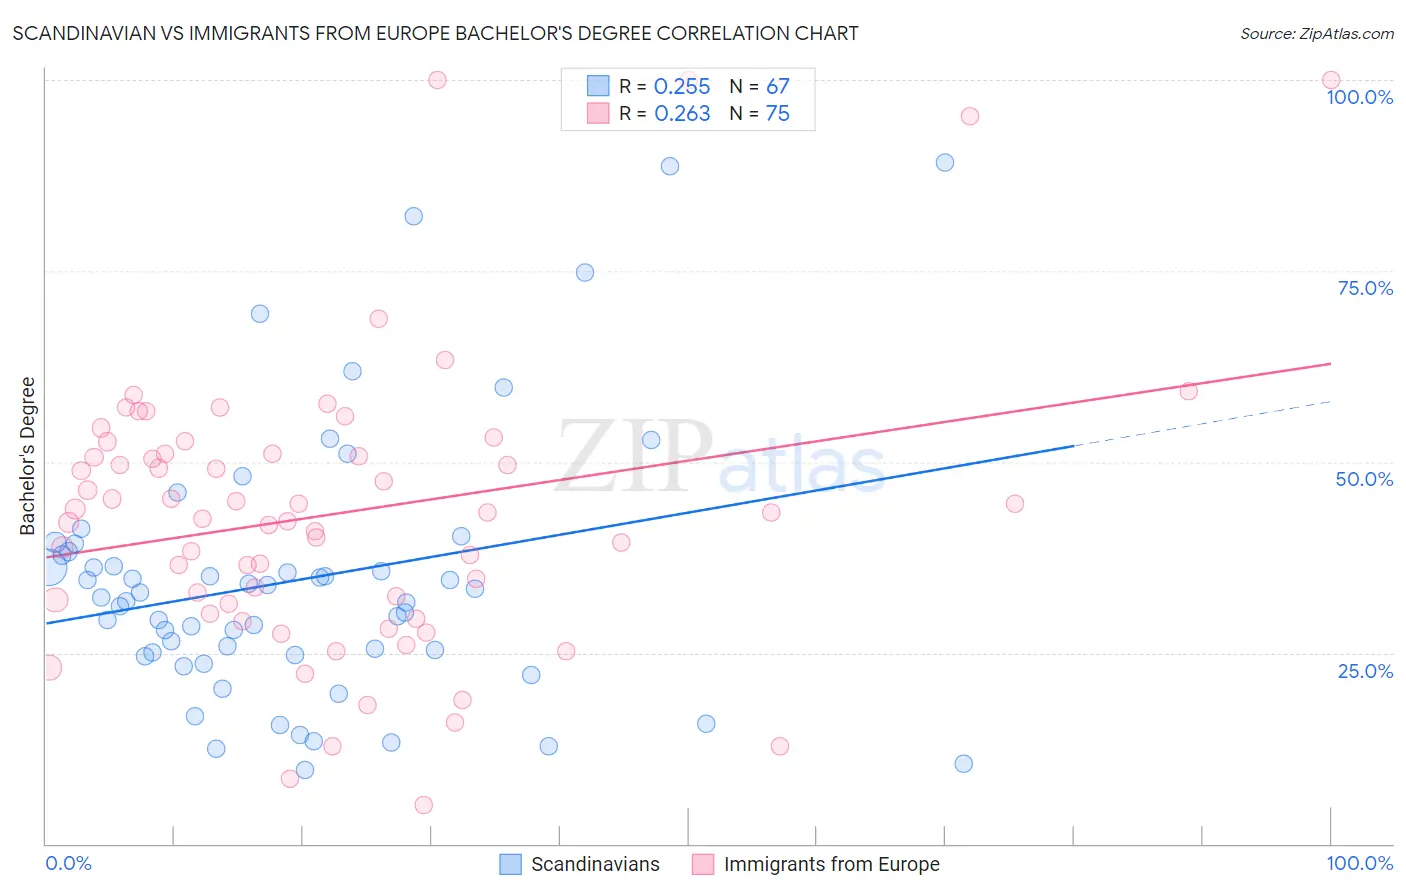
Scandinavian vs Immigrants from Europe Bachelor's Degree Correlation Chart
The statistical analysis conducted on geographies consisting of 472,607,707 people shows a weak positive correlation between the proportion of Scandinavians and percentage of population with at least bachelor's degree education in the United States with a correlation coefficient (R) of 0.255 and weighted average of 37.5%. Similarly, the statistical analysis conducted on geographies consisting of 547,335,067 people shows a weak positive correlation between the proportion of Immigrants from Europe and percentage of population with at least bachelor's degree education in the United States with a correlation coefficient (R) of 0.263 and weighted average of 43.4%, a difference of 15.7%.
Bachelor's Degree Correlation Summary
| Measurement | Scandinavian | Immigrants from Europe |
| Minimum | 9.7% | 5.0% |
| Maximum | 89.2% | 100.0% |
| Range | 79.4% | 95.0% |
| Mean | 34.6% | 43.3% |
| Median | 32.2% | 43.3% |
| Interquartile 25% (IQ1) | 24.7% | 31.4% |
| Interquartile 75% (IQ3) | 38.3% | 51.1% |
| Interquartile Range (IQR) | 13.5% | 19.6% |
| Standard Deviation (Sample) | 17.4% | 18.9% |
| Standard Deviation (Population) | 17.3% | 18.8% |
Similar Demographics by Bachelor's Degree
Demographics Similar to Scandinavians by Bachelor's Degree
In terms of bachelor's degree, the demographic groups most similar to Scandinavians are Senegalese (37.5%, a difference of 0.040%), Immigrants from Peru (37.5%, a difference of 0.040%), Norwegian (37.5%, a difference of 0.14%), Immigrants from Bosnia and Herzegovina (37.6%, a difference of 0.17%), and Immigrants from Senegal (37.6%, a difference of 0.20%).
| Demographics | Rating | Rank | Bachelor's Degree |
| Basques | 47.4 /100 | #177 | Average 37.7% |
| Immigrants | Cameroon | 46.8 /100 | #178 | Average 37.7% |
| Immigrants | Colombia | 45.4 /100 | #179 | Average 37.7% |
| Irish | 44.3 /100 | #180 | Average 37.6% |
| Immigrants | Senegal | 43.8 /100 | #181 | Average 37.6% |
| Immigrants | Bosnia and Herzegovina | 43.4 /100 | #182 | Average 37.6% |
| Senegalese | 42.2 /100 | #183 | Average 37.5% |
| Scandinavians | 41.7 /100 | #184 | Average 37.5% |
| Immigrants | Peru | 41.3 /100 | #185 | Average 37.5% |
| Norwegians | 40.4 /100 | #186 | Average 37.5% |
| English | 39.7 /100 | #187 | Fair 37.4% |
| Immigrants | Oceania | 37.3 /100 | #188 | Fair 37.3% |
| Slovaks | 36.9 /100 | #189 | Fair 37.3% |
| Swiss | 34.1 /100 | #190 | Fair 37.2% |
| Nigerians | 33.9 /100 | #191 | Fair 37.2% |
Demographics Similar to Immigrants from Europe by Bachelor's Degree
In terms of bachelor's degree, the demographic groups most similar to Immigrants from Europe are Immigrants from Kazakhstan (43.4%, a difference of 0.050%), Argentinean (43.3%, a difference of 0.27%), Zimbabwean (43.3%, a difference of 0.28%), Immigrants from Netherlands (43.3%, a difference of 0.30%), and Egyptian (43.3%, a difference of 0.32%).
| Demographics | Rating | Rank | Bachelor's Degree |
| Immigrants | Serbia | 99.9 /100 | #56 | Exceptional 44.1% |
| Paraguayans | 99.9 /100 | #57 | Exceptional 44.0% |
| Immigrants | Czechoslovakia | 99.9 /100 | #58 | Exceptional 44.0% |
| Australians | 99.9 /100 | #59 | Exceptional 44.0% |
| New Zealanders | 99.9 /100 | #60 | Exceptional 44.0% |
| South Africans | 99.8 /100 | #61 | Exceptional 43.6% |
| Immigrants | Kazakhstan | 99.8 /100 | #62 | Exceptional 43.4% |
| Immigrants | Europe | 99.8 /100 | #63 | Exceptional 43.4% |
| Argentineans | 99.7 /100 | #64 | Exceptional 43.3% |
| Zimbabweans | 99.7 /100 | #65 | Exceptional 43.3% |
| Immigrants | Netherlands | 99.7 /100 | #66 | Exceptional 43.3% |
| Egyptians | 99.7 /100 | #67 | Exceptional 43.3% |
| Immigrants | Indonesia | 99.7 /100 | #68 | Exceptional 43.3% |
| Immigrants | Pakistan | 99.7 /100 | #69 | Exceptional 43.1% |
| Immigrants | Romania | 99.6 /100 | #70 | Exceptional 42.9% |