Scandinavian vs Somali Bachelor's Degree
COMPARE
Scandinavian
Somali
Bachelor's Degree
Bachelor's Degree Comparison
Scandinavians
Somalis
37.5%
BACHELOR'S DEGREE
41.7/ 100
METRIC RATING
184th/ 347
METRIC RANK
38.1%
BACHELOR'S DEGREE
58.6/ 100
METRIC RATING
166th/ 347
METRIC RANK
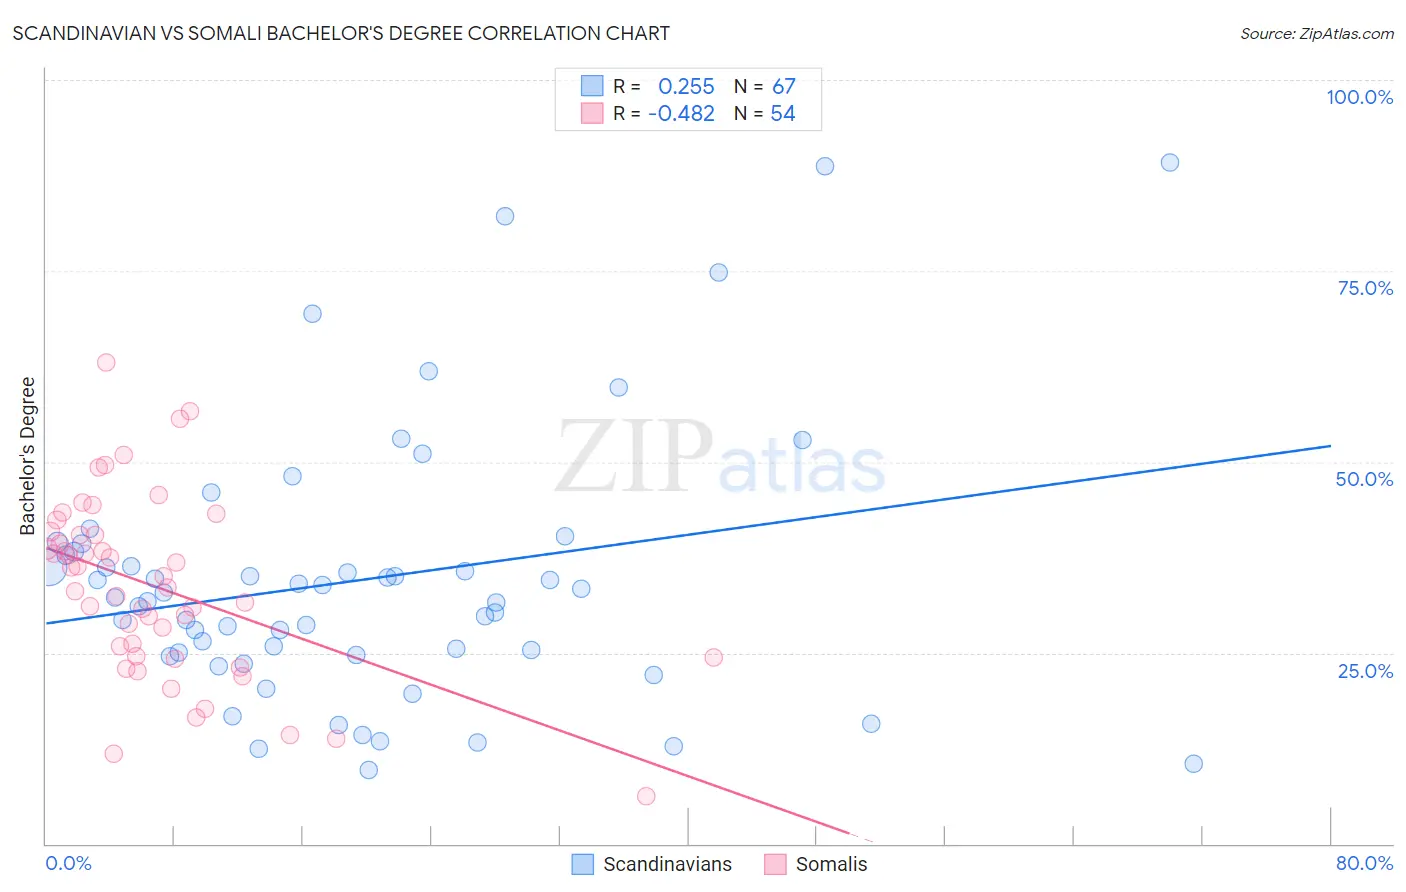
Scandinavian vs Somali Bachelor's Degree Correlation Chart
The statistical analysis conducted on geographies consisting of 472,607,707 people shows a weak positive correlation between the proportion of Scandinavians and percentage of population with at least bachelor's degree education in the United States with a correlation coefficient (R) of 0.255 and weighted average of 37.5%. Similarly, the statistical analysis conducted on geographies consisting of 99,325,880 people shows a moderate negative correlation between the proportion of Somalis and percentage of population with at least bachelor's degree education in the United States with a correlation coefficient (R) of -0.482 and weighted average of 38.1%, a difference of 1.7%.
Bachelor's Degree Correlation Summary
| Measurement | Scandinavian | Somali |
| Minimum | 9.7% | 6.2% |
| Maximum | 89.2% | 63.1% |
| Range | 79.4% | 56.9% |
| Mean | 34.6% | 33.6% |
| Median | 32.2% | 34.3% |
| Interquartile 25% (IQ1) | 24.7% | 24.6% |
| Interquartile 75% (IQ3) | 38.3% | 40.5% |
| Interquartile Range (IQR) | 13.5% | 15.9% |
| Standard Deviation (Sample) | 17.4% | 11.8% |
| Standard Deviation (Population) | 17.3% | 11.7% |
Demographics Similar to Scandinavians and Somalis by Bachelor's Degree
In terms of bachelor's degree, the demographic groups most similar to Scandinavians are Senegalese (37.5%, a difference of 0.040%), Immigrants from Peru (37.5%, a difference of 0.040%), Immigrants from Bosnia and Herzegovina (37.6%, a difference of 0.17%), Immigrants from Senegal (37.6%, a difference of 0.20%), and Irish (37.6%, a difference of 0.26%). Similarly, the demographic groups most similar to Somalis are Sri Lankan (38.2%, a difference of 0.050%), Scottish (38.1%, a difference of 0.21%), Danish (38.1%, a difference of 0.24%), Ghanaian (38.0%, a difference of 0.33%), and Czech (38.0%, a difference of 0.42%).
| Demographics | Rating | Rank | Bachelor's Degree |
| Sri Lankans | 59.1 /100 | #165 | Average 38.2% |
| Somalis | 58.6 /100 | #166 | Average 38.1% |
| Scottish | 56.6 /100 | #167 | Average 38.1% |
| Danes | 56.2 /100 | #168 | Average 38.1% |
| Ghanaians | 55.3 /100 | #169 | Average 38.0% |
| Czechs | 54.4 /100 | #170 | Average 38.0% |
| Bermudans | 54.2 /100 | #171 | Average 38.0% |
| Immigrants | Somalia | 52.8 /100 | #172 | Average 37.9% |
| Immigrants | Iraq | 52.5 /100 | #173 | Average 37.9% |
| Immigrants | Bangladesh | 50.0 /100 | #174 | Average 37.8% |
| Immigrants | Uruguay | 48.3 /100 | #175 | Average 37.8% |
| Costa Ricans | 47.6 /100 | #176 | Average 37.7% |
| Basques | 47.4 /100 | #177 | Average 37.7% |
| Immigrants | Cameroon | 46.8 /100 | #178 | Average 37.7% |
| Immigrants | Colombia | 45.4 /100 | #179 | Average 37.7% |
| Irish | 44.3 /100 | #180 | Average 37.6% |
| Immigrants | Senegal | 43.8 /100 | #181 | Average 37.6% |
| Immigrants | Bosnia and Herzegovina | 43.4 /100 | #182 | Average 37.6% |
| Senegalese | 42.2 /100 | #183 | Average 37.5% |
| Scandinavians | 41.7 /100 | #184 | Average 37.5% |
| Immigrants | Peru | 41.3 /100 | #185 | Average 37.5% |