Scandinavian vs Blackfeet Bachelor's Degree
COMPARE
Scandinavian
Blackfeet
Bachelor's Degree
Bachelor's Degree Comparison
Scandinavians
Blackfeet
37.5%
BACHELOR'S DEGREE
41.7/ 100
METRIC RATING
184th/ 347
METRIC RANK
31.5%
BACHELOR'S DEGREE
0.1/ 100
METRIC RATING
281st/ 347
METRIC RANK
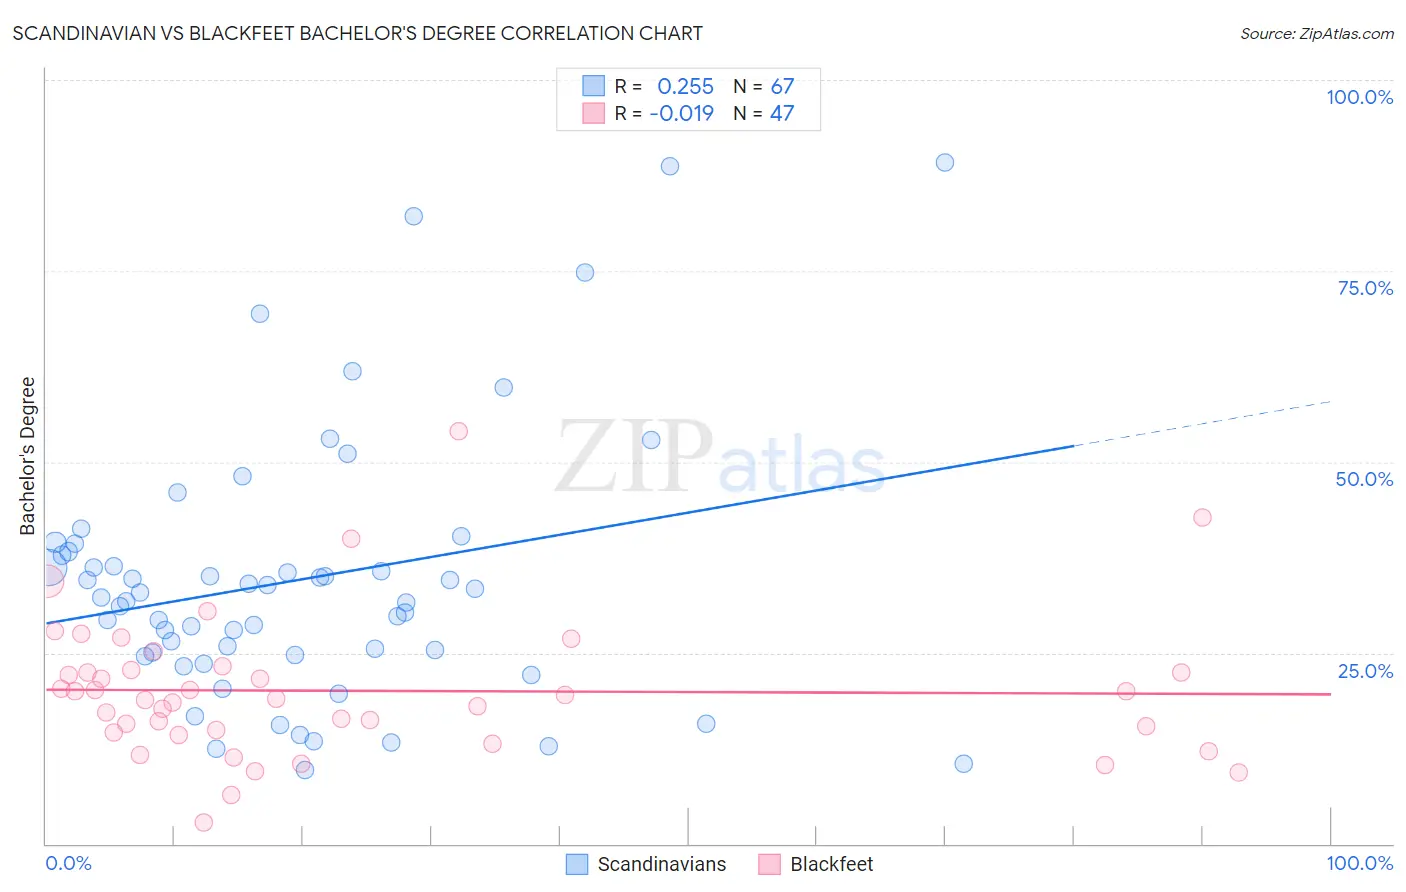
Scandinavian vs Blackfeet Bachelor's Degree Correlation Chart
The statistical analysis conducted on geographies consisting of 472,607,707 people shows a weak positive correlation between the proportion of Scandinavians and percentage of population with at least bachelor's degree education in the United States with a correlation coefficient (R) of 0.255 and weighted average of 37.5%. Similarly, the statistical analysis conducted on geographies consisting of 309,572,502 people shows no correlation between the proportion of Blackfeet and percentage of population with at least bachelor's degree education in the United States with a correlation coefficient (R) of -0.019 and weighted average of 31.5%, a difference of 19.2%.
Bachelor's Degree Correlation Summary
| Measurement | Scandinavian | Blackfeet |
| Minimum | 9.7% | 2.7% |
| Maximum | 89.2% | 53.9% |
| Range | 79.4% | 51.2% |
| Mean | 34.6% | 20.0% |
| Median | 32.2% | 18.9% |
| Interquartile 25% (IQ1) | 24.7% | 14.5% |
| Interquartile 75% (IQ3) | 38.3% | 22.7% |
| Interquartile Range (IQR) | 13.5% | 8.2% |
| Standard Deviation (Sample) | 17.4% | 9.3% |
| Standard Deviation (Population) | 17.3% | 9.2% |
Similar Demographics by Bachelor's Degree
Demographics Similar to Scandinavians by Bachelor's Degree
In terms of bachelor's degree, the demographic groups most similar to Scandinavians are Senegalese (37.5%, a difference of 0.040%), Immigrants from Peru (37.5%, a difference of 0.040%), Norwegian (37.5%, a difference of 0.14%), Immigrants from Bosnia and Herzegovina (37.6%, a difference of 0.17%), and Immigrants from Senegal (37.6%, a difference of 0.20%).
| Demographics | Rating | Rank | Bachelor's Degree |
| Basques | 47.4 /100 | #177 | Average 37.7% |
| Immigrants | Cameroon | 46.8 /100 | #178 | Average 37.7% |
| Immigrants | Colombia | 45.4 /100 | #179 | Average 37.7% |
| Irish | 44.3 /100 | #180 | Average 37.6% |
| Immigrants | Senegal | 43.8 /100 | #181 | Average 37.6% |
| Immigrants | Bosnia and Herzegovina | 43.4 /100 | #182 | Average 37.6% |
| Senegalese | 42.2 /100 | #183 | Average 37.5% |
| Scandinavians | 41.7 /100 | #184 | Average 37.5% |
| Immigrants | Peru | 41.3 /100 | #185 | Average 37.5% |
| Norwegians | 40.4 /100 | #186 | Average 37.5% |
| English | 39.7 /100 | #187 | Fair 37.4% |
| Immigrants | Oceania | 37.3 /100 | #188 | Fair 37.3% |
| Slovaks | 36.9 /100 | #189 | Fair 37.3% |
| Swiss | 34.1 /100 | #190 | Fair 37.2% |
| Nigerians | 33.9 /100 | #191 | Fair 37.2% |
Demographics Similar to Blackfeet by Bachelor's Degree
In terms of bachelor's degree, the demographic groups most similar to Blackfeet are Immigrants from Caribbean (31.4%, a difference of 0.15%), Honduran (31.3%, a difference of 0.42%), Haitian (31.3%, a difference of 0.45%), Immigrants from Laos (31.6%, a difference of 0.46%), and Aleut (31.3%, a difference of 0.47%).
| Demographics | Rating | Rank | Bachelor's Degree |
| Potawatomi | 0.2 /100 | #274 | Tragic 31.9% |
| Samoans | 0.1 /100 | #275 | Tragic 31.8% |
| Salvadorans | 0.1 /100 | #276 | Tragic 31.8% |
| Dominicans | 0.1 /100 | #277 | Tragic 31.8% |
| Marshallese | 0.1 /100 | #278 | Tragic 31.7% |
| Hawaiians | 0.1 /100 | #279 | Tragic 31.6% |
| Immigrants | Laos | 0.1 /100 | #280 | Tragic 31.6% |
| Blackfeet | 0.1 /100 | #281 | Tragic 31.5% |
| Immigrants | Caribbean | 0.1 /100 | #282 | Tragic 31.4% |
| Hondurans | 0.1 /100 | #283 | Tragic 31.3% |
| Haitians | 0.1 /100 | #284 | Tragic 31.3% |
| Aleuts | 0.1 /100 | #285 | Tragic 31.3% |
| Immigrants | El Salvador | 0.1 /100 | #286 | Tragic 31.3% |
| Ottawa | 0.1 /100 | #287 | Tragic 31.1% |
| Guatemalans | 0.1 /100 | #288 | Tragic 31.0% |