Japanese vs Comanche Bachelor's Degree
COMPARE
Japanese
Comanche
Bachelor's Degree
Bachelor's Degree Comparison
Japanese
Comanche
33.3%
BACHELOR'S DEGREE
0.7/ 100
METRIC RATING
251st/ 347
METRIC RANK
31.9%
BACHELOR'S DEGREE
0.2/ 100
METRIC RATING
272nd/ 347
METRIC RANK
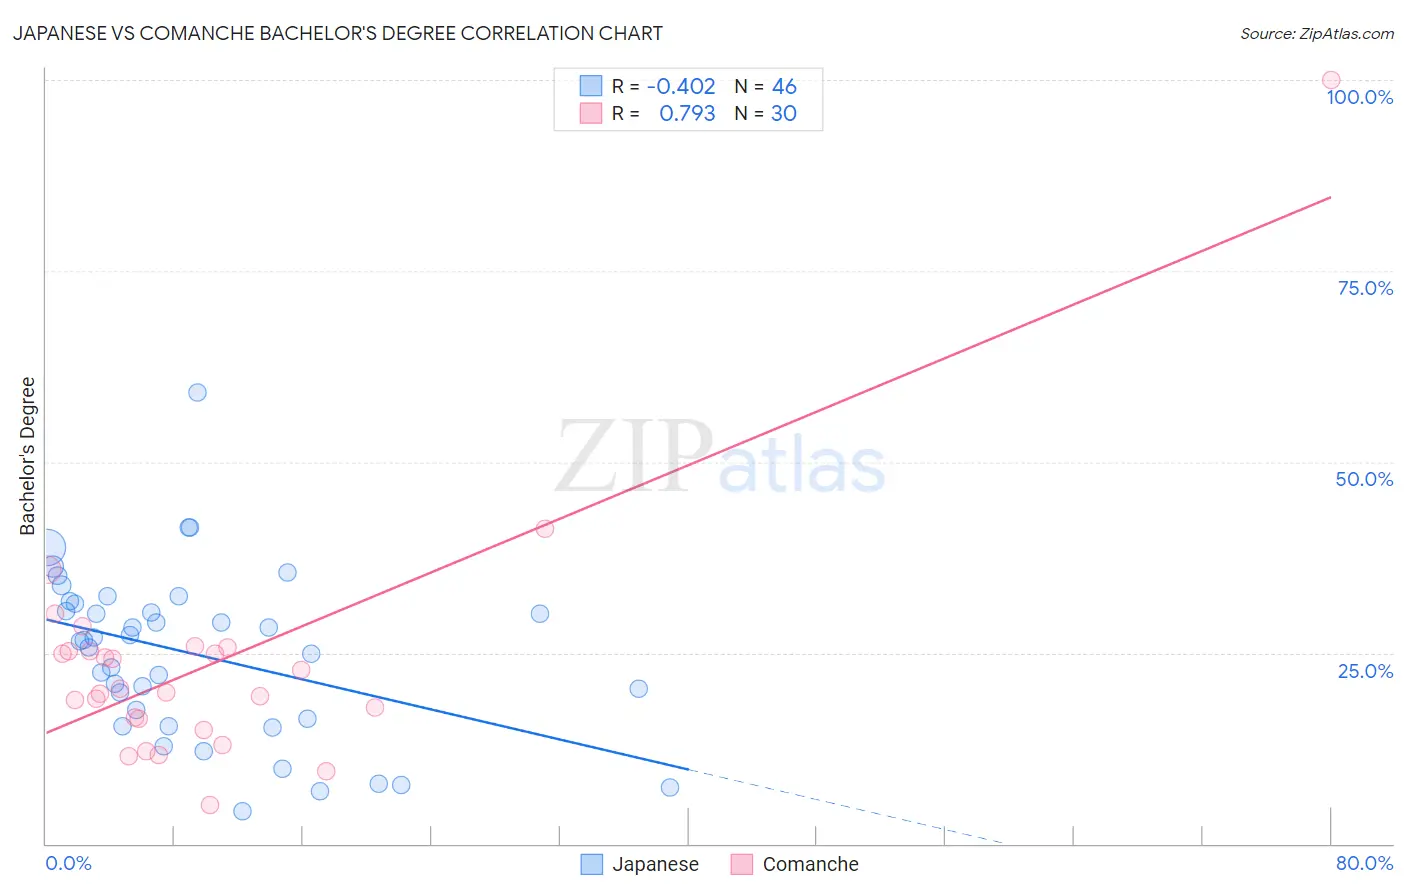
Japanese vs Comanche Bachelor's Degree Correlation Chart
The statistical analysis conducted on geographies consisting of 249,171,435 people shows a moderate negative correlation between the proportion of Japanese and percentage of population with at least bachelor's degree education in the United States with a correlation coefficient (R) of -0.402 and weighted average of 33.3%. Similarly, the statistical analysis conducted on geographies consisting of 109,781,211 people shows a strong positive correlation between the proportion of Comanche and percentage of population with at least bachelor's degree education in the United States with a correlation coefficient (R) of 0.793 and weighted average of 31.9%, a difference of 4.5%.
Bachelor's Degree Correlation Summary
| Measurement | Japanese | Comanche |
| Minimum | 4.3% | 5.1% |
| Maximum | 59.2% | 100.0% |
| Range | 54.9% | 94.9% |
| Mean | 24.8% | 23.5% |
| Median | 26.5% | 20.1% |
| Interquartile 25% (IQ1) | 16.3% | 16.4% |
| Interquartile 75% (IQ3) | 31.5% | 25.1% |
| Interquartile Range (IQR) | 15.1% | 8.7% |
| Standard Deviation (Sample) | 11.0% | 16.4% |
| Standard Deviation (Population) | 10.8% | 16.1% |
Similar Demographics by Bachelor's Degree
Demographics Similar to Japanese by Bachelor's Degree
In terms of bachelor's degree, the demographic groups most similar to Japanese are Immigrants from Bahamas (33.3%, a difference of 0.070%), U.S. Virgin Islander (33.2%, a difference of 0.28%), Native Hawaiian (33.2%, a difference of 0.34%), Iroquois (33.2%, a difference of 0.36%), and Nicaraguan (33.1%, a difference of 0.54%).
| Demographics | Rating | Rank | Bachelor's Degree |
| Delaware | 1.2 /100 | #244 | Tragic 33.8% |
| Immigrants | Fiji | 1.2 /100 | #245 | Tragic 33.7% |
| Jamaicans | 1.0 /100 | #246 | Tragic 33.6% |
| Immigrants | Congo | 1.0 /100 | #247 | Tragic 33.6% |
| Cree | 1.0 /100 | #248 | Tragic 33.6% |
| Immigrants | Liberia | 0.9 /100 | #249 | Tragic 33.5% |
| Indonesians | 0.9 /100 | #250 | Tragic 33.5% |
| Japanese | 0.7 /100 | #251 | Tragic 33.3% |
| Immigrants | Bahamas | 0.7 /100 | #252 | Tragic 33.3% |
| U.S. Virgin Islanders | 0.7 /100 | #253 | Tragic 33.2% |
| Native Hawaiians | 0.7 /100 | #254 | Tragic 33.2% |
| Iroquois | 0.7 /100 | #255 | Tragic 33.2% |
| Nicaraguans | 0.6 /100 | #256 | Tragic 33.1% |
| Spanish Americans | 0.6 /100 | #257 | Tragic 33.1% |
| French American Indians | 0.6 /100 | #258 | Tragic 33.1% |
Demographics Similar to Comanche by Bachelor's Degree
In terms of bachelor's degree, the demographic groups most similar to Comanche are Central American (31.9%, a difference of 0.030%), Immigrants from Nicaragua (31.9%, a difference of 0.12%), American (31.9%, a difference of 0.12%), Potawatomi (31.9%, a difference of 0.14%), and Samoan (31.8%, a difference of 0.27%).
| Demographics | Rating | Rank | Bachelor's Degree |
| Bahamians | 0.3 /100 | #265 | Tragic 32.5% |
| Immigrants | Dominica | 0.3 /100 | #266 | Tragic 32.5% |
| Cubans | 0.3 /100 | #267 | Tragic 32.5% |
| Immigrants | Portugal | 0.2 /100 | #268 | Tragic 32.2% |
| Immigrants | Belize | 0.2 /100 | #269 | Tragic 32.1% |
| Immigrants | Nicaragua | 0.2 /100 | #270 | Tragic 31.9% |
| Central Americans | 0.2 /100 | #271 | Tragic 31.9% |
| Comanche | 0.2 /100 | #272 | Tragic 31.9% |
| Americans | 0.2 /100 | #273 | Tragic 31.9% |
| Potawatomi | 0.2 /100 | #274 | Tragic 31.9% |
| Samoans | 0.1 /100 | #275 | Tragic 31.8% |
| Salvadorans | 0.1 /100 | #276 | Tragic 31.8% |
| Dominicans | 0.1 /100 | #277 | Tragic 31.8% |
| Marshallese | 0.1 /100 | #278 | Tragic 31.7% |
| Hawaiians | 0.1 /100 | #279 | Tragic 31.6% |