Scandinavian vs Immigrants from Hungary Bachelor's Degree
COMPARE
Scandinavian
Immigrants from Hungary
Bachelor's Degree
Bachelor's Degree Comparison
Scandinavians
Immigrants from Hungary
37.5%
BACHELOR'S DEGREE
41.7/ 100
METRIC RATING
184th/ 347
METRIC RANK
42.3%
BACHELOR'S DEGREE
99.2/ 100
METRIC RATING
81st/ 347
METRIC RANK
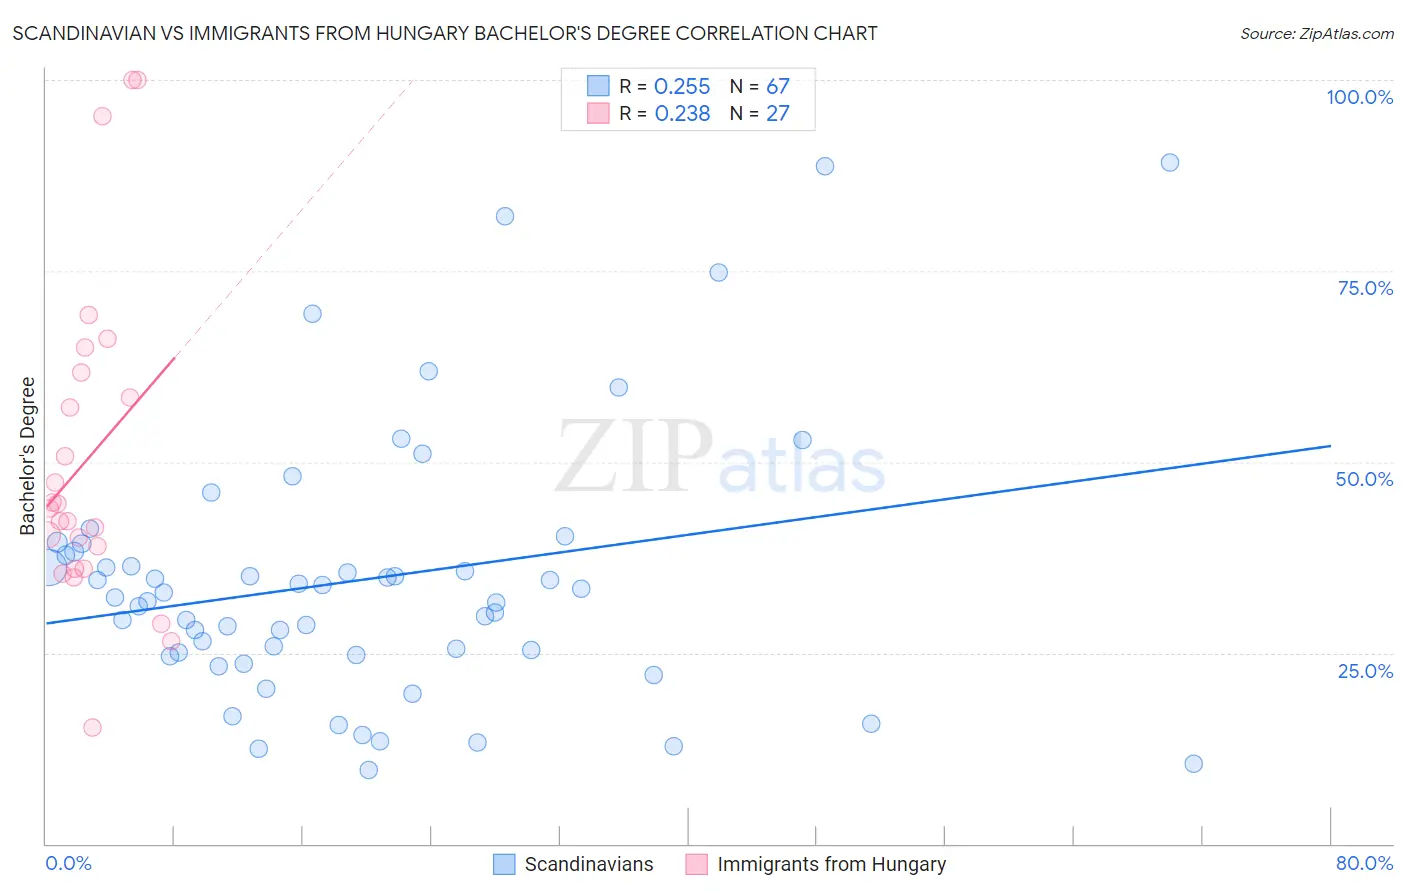
Scandinavian vs Immigrants from Hungary Bachelor's Degree Correlation Chart
The statistical analysis conducted on geographies consisting of 472,607,707 people shows a weak positive correlation between the proportion of Scandinavians and percentage of population with at least bachelor's degree education in the United States with a correlation coefficient (R) of 0.255 and weighted average of 37.5%. Similarly, the statistical analysis conducted on geographies consisting of 195,704,422 people shows a weak positive correlation between the proportion of Immigrants from Hungary and percentage of population with at least bachelor's degree education in the United States with a correlation coefficient (R) of 0.238 and weighted average of 42.3%, a difference of 12.8%.
Bachelor's Degree Correlation Summary
| Measurement | Scandinavian | Immigrants from Hungary |
| Minimum | 9.7% | 15.2% |
| Maximum | 89.2% | 100.0% |
| Range | 79.4% | 84.8% |
| Mean | 34.6% | 50.5% |
| Median | 32.2% | 43.9% |
| Interquartile 25% (IQ1) | 24.7% | 36.1% |
| Interquartile 75% (IQ3) | 38.3% | 61.7% |
| Interquartile Range (IQR) | 13.5% | 25.6% |
| Standard Deviation (Sample) | 17.4% | 21.3% |
| Standard Deviation (Population) | 17.3% | 20.9% |
Similar Demographics by Bachelor's Degree
Demographics Similar to Scandinavians by Bachelor's Degree
In terms of bachelor's degree, the demographic groups most similar to Scandinavians are Senegalese (37.5%, a difference of 0.040%), Immigrants from Peru (37.5%, a difference of 0.040%), Norwegian (37.5%, a difference of 0.14%), Immigrants from Bosnia and Herzegovina (37.6%, a difference of 0.17%), and Immigrants from Senegal (37.6%, a difference of 0.20%).
| Demographics | Rating | Rank | Bachelor's Degree |
| Basques | 47.4 /100 | #177 | Average 37.7% |
| Immigrants | Cameroon | 46.8 /100 | #178 | Average 37.7% |
| Immigrants | Colombia | 45.4 /100 | #179 | Average 37.7% |
| Irish | 44.3 /100 | #180 | Average 37.6% |
| Immigrants | Senegal | 43.8 /100 | #181 | Average 37.6% |
| Immigrants | Bosnia and Herzegovina | 43.4 /100 | #182 | Average 37.6% |
| Senegalese | 42.2 /100 | #183 | Average 37.5% |
| Scandinavians | 41.7 /100 | #184 | Average 37.5% |
| Immigrants | Peru | 41.3 /100 | #185 | Average 37.5% |
| Norwegians | 40.4 /100 | #186 | Average 37.5% |
| English | 39.7 /100 | #187 | Fair 37.4% |
| Immigrants | Oceania | 37.3 /100 | #188 | Fair 37.3% |
| Slovaks | 36.9 /100 | #189 | Fair 37.3% |
| Swiss | 34.1 /100 | #190 | Fair 37.2% |
| Nigerians | 33.9 /100 | #191 | Fair 37.2% |
Demographics Similar to Immigrants from Hungary by Bachelor's Degree
In terms of bachelor's degree, the demographic groups most similar to Immigrants from Hungary are Immigrants from Croatia (42.3%, a difference of 0.020%), Immigrants from Scotland (42.3%, a difference of 0.070%), Armenian (42.3%, a difference of 0.10%), Immigrants from Western Asia (42.3%, a difference of 0.11%), and Lithuanian (42.2%, a difference of 0.14%).
| Demographics | Rating | Rank | Bachelor's Degree |
| Bhutanese | 99.5 /100 | #74 | Exceptional 42.7% |
| Immigrants | Zimbabwe | 99.4 /100 | #75 | Exceptional 42.6% |
| Immigrants | Egypt | 99.4 /100 | #76 | Exceptional 42.6% |
| Immigrants | Eastern Europe | 99.4 /100 | #77 | Exceptional 42.5% |
| Immigrants | Ethiopia | 99.4 /100 | #78 | Exceptional 42.5% |
| Immigrants | Lebanon | 99.3 /100 | #79 | Exceptional 42.4% |
| Immigrants | Croatia | 99.2 /100 | #80 | Exceptional 42.3% |
| Immigrants | Hungary | 99.2 /100 | #81 | Exceptional 42.3% |
| Immigrants | Scotland | 99.2 /100 | #82 | Exceptional 42.3% |
| Armenians | 99.2 /100 | #83 | Exceptional 42.3% |
| Immigrants | Western Asia | 99.2 /100 | #84 | Exceptional 42.3% |
| Lithuanians | 99.2 /100 | #85 | Exceptional 42.2% |
| Immigrants | Brazil | 99.2 /100 | #86 | Exceptional 42.2% |
| Carpatho Rusyns | 99.0 /100 | #87 | Exceptional 42.1% |
| Immigrants | Western Europe | 99.0 /100 | #88 | Exceptional 42.0% |