Ethiopian vs Comanche Bachelor's Degree

COMPARE

Ethiopian
Race
Ancestry
AfghanAfricanAlaska NativeAlaskan AthabascanAlbanianAleutAlsatianAmericanApacheArabArapahoArgentineanArmenianAssyrian/Chaldean/SyriacAustralianAustrianBahamianBangladeshiBarbadianBasqueBelgianBelizeanBermudanBhutaneseBlackfeetBolivianBrazilianBritishBritish West IndianBulgarianBurmeseCajunCambodianCanadianCape VerdeanCarpatho RusynCelticCentral AmericanCentral American IndianCherokeeCheyenneChickasawChileanChineseChippewaChoctawColombianColvilleCosta RicanCreeCreekCroatianCrowCubanCypriotCzechCzechoslovakianDanishDelawareDominicanDutchDutch West IndianEastern EuropeanEcuadorianEgyptianEnglishEstonianEthiopianEuropeanFijianFilipinoFinnishFrenchFrench American IndianFrench CanadianGermanGerman RussianGhanaianGreekGuamanian/ChamorroGuatemalanGuyaneseHaitianHmongHonduranHopiHoumaHungarianIcelanderIndian (Asian)IndonesianInupiatIranianIraqiIrishIroquoisIsraeliItalianJamaicanJapaneseJordanianKenyanKiowaKoreanLaotianLatvianLebaneseLiberianLithuanianLumbeeLuxembourgerMacedonianMalaysianMalteseMarshalleseMenomineeMexicanMexican American IndianMongolianMoroccanNative HawaiianNavajoNepaleseNew ZealanderNicaraguanNigerianNorthern EuropeanNorwegianOkinawanOsageOttawaPaiutePakistaniPalestinianPanamanianParaguayanPennsylvania GermanPeruvianPimaPolishPortuguesePotawatomiPuebloPuerto RicanPuget Sound SalishRomanianRussianSalvadoranSamoanScandinavianScotch-IrishScottishSeminoleSenegaleseSerbianShoshoneSierra LeoneanSiouxSlavicSlovakSloveneSomaliSouth AfricanSouth AmericanSouth American IndianSoviet UnionSpaniardSpanishSpanish AmericanSpanish American IndianSri LankanSubsaharan AfricanSudaneseSwedishSwissSyrianTaiwaneseThaiTlingit-HaidaTohono O'OdhamTonganTrinidadian and TobagonianTsimshianTurkishU.S. Virgin IslanderUgandanUkrainianUruguayanUteVenezuelanVietnameseWelshWest IndianYakamaYaquiYugoslavianYumanYup'ikZimbabwean
Immigration
NonimmigrantsImmigrantsAfghanistanAfricaAlbaniaArgentinaArmeniaAsiaAustraliaAustriaBahamasBangladeshBarbadosBelarusBelgiumBelizeBoliviaBosnia and HerzegovinaBrazilBulgariaBurma/MyanmarCabo VerdeCambodiaCameroonCanadaCaribbeanCentral AmericaChileChinaColombiaCongoCosta RicaCroatiaCubaCzechoslovakiaDenmarkDominicaDominican RepublicEastern AfricaEastern AsiaEastern EuropeEcuadorEgyptEl SalvadorEnglandEritreaEthiopiaEuropeFijiFranceGermanyGhanaGreeceGrenadaGuatemalaGuyanaHaitiHondurasHong KongHungaryIndiaIndonesiaIranIraqIrelandIsraelItalyJamaicaJapanJordanKazakhstanKenyaKoreaKuwaitLaosLatin AmericaLatviaLebanonLiberiaLithuaniaMalaysiaMexicoMicronesiaMiddle AfricaMoldovaMoroccoNepalNetherlandsNicaraguaNigeriaNorth AmericaNorth MacedoniaNorthern AfricaNorthern EuropeNorwayOceaniaPakistanPanamaPeruPhilippinesPolandPortugalRomaniaRussiaSaudi ArabiaScotlandSenegalSerbiaSierra LeoneSingaporeSomaliaSouth AfricaSouth AmericaSouth Central AsiaSouth Eastern AsiaSouthern EuropeSpainSri LankaSt. Vincent and the GrenadinesSudanSwedenSwitzerlandSyriaTaiwanThailandTrinidad and TobagoTurkeyUgandaUkraineUruguayUzbekistanVenezuelaVietnamWest IndiesWestern AfricaWestern AsiaWestern EuropeYemenZaireZimbabweAzores
Comanche
Race
Ancestry
AfghanAfricanAlaska NativeAlaskan AthabascanAlbanianAleutAlsatianAmericanApacheArabArapahoArgentineanArmenianAssyrian/Chaldean/SyriacAustralianAustrianBahamianBangladeshiBarbadianBasqueBelgianBelizeanBermudanBhutaneseBlackfeetBolivianBrazilianBritishBritish West IndianBulgarianBurmeseCajunCambodianCanadianCape VerdeanCarpatho RusynCelticCentral AmericanCentral American IndianCherokeeCheyenneChickasawChileanChineseChippewaChoctawColombianColvilleComancheCosta RicanCreeCreekCroatianCrowCubanCypriotCzechCzechoslovakianDanishDelawareDominicanDutchDutch West IndianEastern EuropeanEcuadorianEgyptianEnglishEstonianEuropeanFijianFilipinoFinnishFrenchFrench American IndianFrench CanadianGermanGerman RussianGhanaianGreekGuamanian/ChamorroGuatemalanGuyaneseHaitianHmongHonduranHopiHoumaHungarianIcelanderIndian (Asian)IndonesianInupiatIranianIraqiIrishIroquoisIsraeliItalianJamaicanJapaneseJordanianKenyanKiowaKoreanLaotianLatvianLebaneseLiberianLithuanianLumbeeLuxembourgerMacedonianMalaysianMalteseMarshalleseMenomineeMexicanMexican American IndianMongolianMoroccanNative HawaiianNavajoNepaleseNew ZealanderNicaraguanNigerianNorthern EuropeanNorwegianOkinawanOsageOttawaPaiutePakistaniPalestinianPanamanianParaguayanPennsylvania GermanPeruvianPimaPolishPortuguesePotawatomiPuebloPuerto RicanPuget Sound SalishRomanianRussianSalvadoranSamoanScandinavianScotch-IrishScottishSeminoleSenegaleseSerbianShoshoneSierra LeoneanSiouxSlavicSlovakSloveneSomaliSouth AfricanSouth AmericanSouth American IndianSoviet UnionSpaniardSpanishSpanish AmericanSpanish American IndianSri LankanSubsaharan AfricanSudaneseSwedishSwissSyrianTaiwaneseThaiTlingit-HaidaTohono O'OdhamTonganTrinidadian and TobagonianTsimshianTurkishU.S. Virgin IslanderUgandanUkrainianUruguayanUteVenezuelanVietnameseWelshWest IndianYakamaYaquiYugoslavianYumanYup'ikZimbabwean
Immigration
NonimmigrantsImmigrantsAfghanistanAfricaAlbaniaArgentinaArmeniaAsiaAustraliaAustriaBahamasBangladeshBarbadosBelarusBelgiumBelizeBoliviaBosnia and HerzegovinaBrazilBulgariaBurma/MyanmarCabo VerdeCambodiaCameroonCanadaCaribbeanCentral AmericaChileChinaColombiaCongoCosta RicaCroatiaCubaCzechoslovakiaDenmarkDominicaDominican RepublicEastern AfricaEastern AsiaEastern EuropeEcuadorEgyptEl SalvadorEnglandEritreaEthiopiaEuropeFijiFranceGermanyGhanaGreeceGrenadaGuatemalaGuyanaHaitiHondurasHong KongHungaryIndiaIndonesiaIranIraqIrelandIsraelItalyJamaicaJapanJordanKazakhstanKenyaKoreaKuwaitLaosLatin AmericaLatviaLebanonLiberiaLithuaniaMalaysiaMexicoMicronesiaMiddle AfricaMoldovaMoroccoNepalNetherlandsNicaraguaNigeriaNorth AmericaNorth MacedoniaNorthern AfricaNorthern EuropeNorwayOceaniaPakistanPanamaPeruPhilippinesPolandPortugalRomaniaRussiaSaudi ArabiaScotlandSenegalSerbiaSierra LeoneSingaporeSomaliaSouth AfricaSouth AmericaSouth Central AsiaSouth Eastern AsiaSouthern EuropeSpainSri LankaSt. Vincent and the GrenadinesSudanSwedenSwitzerlandSyriaTaiwanThailandTrinidad and TobagoTurkeyUgandaUkraineUruguayUzbekistanVenezuelaVietnamWest IndiesWestern AfricaWestern AsiaWestern EuropeYemenZaireZimbabweAzores
Bachelor's Degree
Income
Poverty
Unemployment
Labor Participation
Family Structure
Vehicle Availability
Education Level
Disability

Bachelor's Degree Comparison

Ethiopians

Comanche

Exceptional
Tragic
42.8%
BACHELOR'S DEGREE
99.5/ 100
METRIC RATING
72nd/ 347
METRIC RANK
31.9%
BACHELOR'S DEGREE
0.2/ 100
METRIC RATING
272nd/ 347
METRIC RANK

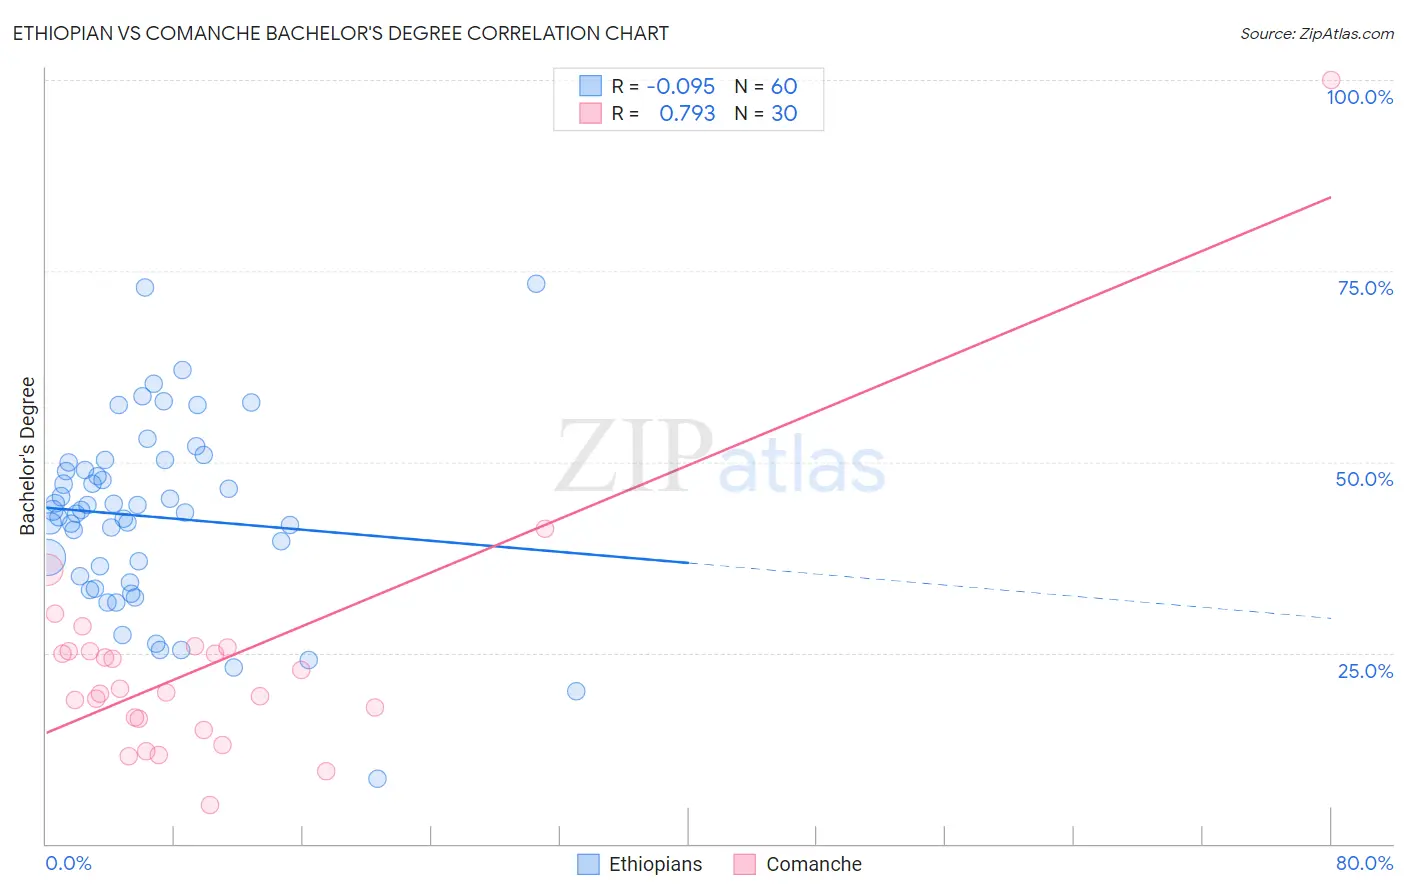
Ethiopian vs Comanche Bachelor's Degree Correlation Chart

The statistical analysis conducted on geographies consisting of 223,255,026 people shows a slight negative correlation between the proportion of Ethiopians and percentage of population with at least bachelor's degree education in the United States with a correlation coefficient (R) of -0.095 and weighted average of 42.8%. Similarly, the statistical analysis conducted on geographies consisting of 109,781,211 people shows a strong positive correlation between the proportion of Comanche and percentage of population with at least bachelor's degree education in the United States with a correlation coefficient (R) of 0.793 and weighted average of 31.9%, a difference of 34.1%.
Ethiopian vs Comanche Bachelor's Degree

Bachelor's Degree Correlation Summary

MeasurementEthiopianComanche
Minimum8.5%5.1%
Maximum73.3%100.0%
Range64.9%94.9%
Mean42.8%23.5%
Median43.5%20.1%
Interquartile 25% (IQ1)34.6%16.4%
Interquartile 75% (IQ3)49.4%25.1%
Interquartile Range (IQR)14.8%8.7%
Standard Deviation (Sample)12.2%16.4%
Standard Deviation (Population)12.1%16.1%

Similar Demographics by Bachelor's Degree

Demographics Similar to Ethiopians by Bachelor's Degree

In terms of bachelor's degree, the demographic groups most similar to Ethiopians are Immigrants from Uzbekistan (42.8%, a difference of 0.050%), Immigrants from Argentina (42.8%, a difference of 0.090%), Bhutanese (42.7%, a difference of 0.27%), Immigrants from Romania (42.9%, a difference of 0.35%), and Immigrants from Zimbabwe (42.6%, a difference of 0.48%).
DemographicsRating | RankBachelor's Degree
Zimbabweans
99.7
/100
|
#65
Exceptional
43.3%
Immigrants | Netherlands
99.7
/100
|
#66
Exceptional
43.3%
Egyptians
99.7
/100
|
#67
Exceptional
43.3%
Immigrants | Indonesia
99.7
/100
|
#68
Exceptional
43.3%
Immigrants | Pakistan
99.7
/100
|
#69
Exceptional
43.1%
Immigrants | Romania
99.6
/100
|
#70
Exceptional
42.9%
Immigrants | Argentina
99.6
/100
|
#71
Exceptional
42.8%
Ethiopians
99.5
/100
|
#72
Exceptional
42.8%
Immigrants | Uzbekistan
99.5
/100
|
#73
Exceptional
42.8%
Bhutanese
99.5
/100
|
#74
Exceptional
42.7%
Immigrants | Zimbabwe
99.4
/100
|
#75
Exceptional
42.6%
Immigrants | Egypt
99.4
/100
|
#76
Exceptional
42.6%
Immigrants | Eastern Europe
99.4
/100
|
#77
Exceptional
42.5%
Immigrants | Ethiopia
99.4
/100
|
#78
Exceptional
42.5%
Immigrants | Lebanon
99.3
/100
|
#79
Exceptional
42.4%

Demographics Similar to Comanche by Bachelor's Degree

In terms of bachelor's degree, the demographic groups most similar to Comanche are Central American (31.9%, a difference of 0.030%), Immigrants from Nicaragua (31.9%, a difference of 0.12%), American (31.9%, a difference of 0.12%), Potawatomi (31.9%, a difference of 0.14%), and Samoan (31.8%, a difference of 0.27%).
DemographicsRating | RankBachelor's Degree
Bahamians
0.3
/100
|
#265
Tragic
32.5%
Immigrants | Dominica
0.3
/100
|
#266
Tragic
32.5%
Cubans
0.3
/100
|
#267
Tragic
32.5%
Immigrants | Portugal
0.2
/100
|
#268
Tragic
32.2%
Immigrants | Belize
0.2
/100
|
#269
Tragic
32.1%
Immigrants | Nicaragua
0.2
/100
|
#270
Tragic
31.9%
Central Americans
0.2
/100
|
#271
Tragic
31.9%
Comanche
0.2
/100
|
#272
Tragic
31.9%
Americans
0.2
/100
|
#273
Tragic
31.9%
Potawatomi
0.2
/100
|
#274
Tragic
31.9%
Samoans
0.1
/100
|
#275
Tragic
31.8%
Salvadorans
0.1
/100
|
#276
Tragic
31.8%
Dominicans
0.1
/100
|
#277
Tragic
31.8%
Marshallese
0.1
/100
|
#278
Tragic
31.7%
Hawaiians
0.1
/100
|
#279
Tragic
31.6%