Luxembourger vs Comanche Bachelor's Degree
COMPARE
Luxembourger
Comanche
Bachelor's Degree
Bachelor's Degree Comparison
Luxembourgers
Comanche
39.8%
BACHELOR'S DEGREE
89.1/ 100
METRIC RATING
135th/ 347
METRIC RANK
31.9%
BACHELOR'S DEGREE
0.2/ 100
METRIC RATING
272nd/ 347
METRIC RANK
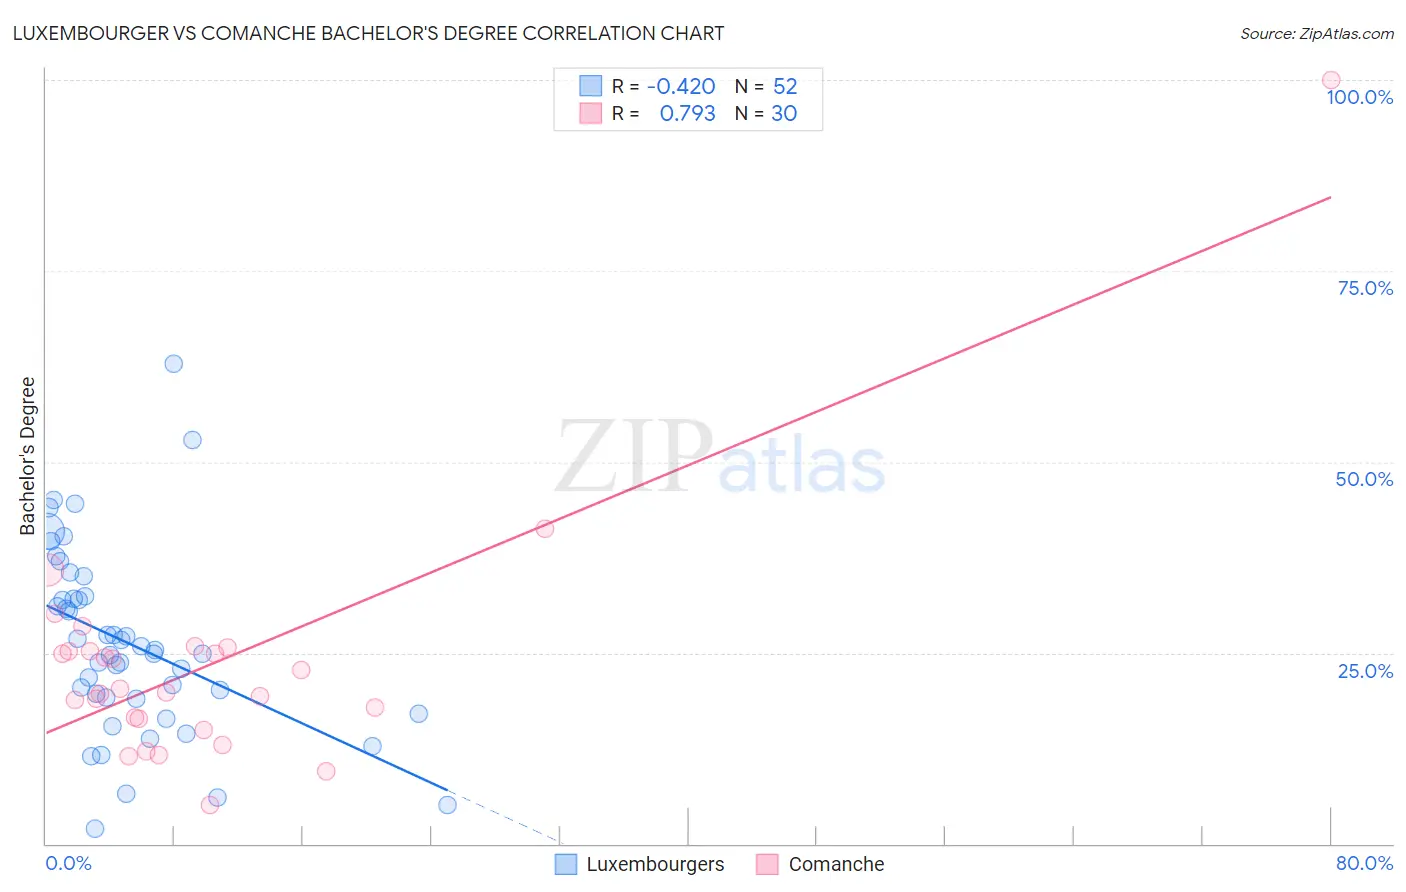
Luxembourger vs Comanche Bachelor's Degree Correlation Chart
The statistical analysis conducted on geographies consisting of 144,665,443 people shows a moderate negative correlation between the proportion of Luxembourgers and percentage of population with at least bachelor's degree education in the United States with a correlation coefficient (R) of -0.420 and weighted average of 39.8%. Similarly, the statistical analysis conducted on geographies consisting of 109,781,211 people shows a strong positive correlation between the proportion of Comanche and percentage of population with at least bachelor's degree education in the United States with a correlation coefficient (R) of 0.793 and weighted average of 31.9%, a difference of 24.6%.
Bachelor's Degree Correlation Summary
| Measurement | Luxembourger | Comanche |
| Minimum | 2.0% | 5.1% |
| Maximum | 62.9% | 100.0% |
| Range | 60.9% | 94.9% |
| Mean | 26.2% | 23.5% |
| Median | 25.1% | 20.1% |
| Interquartile 25% (IQ1) | 19.0% | 16.4% |
| Interquartile 75% (IQ3) | 32.2% | 25.1% |
| Interquartile Range (IQR) | 13.2% | 8.7% |
| Standard Deviation (Sample) | 12.2% | 16.4% |
| Standard Deviation (Population) | 12.1% | 16.1% |
Similar Demographics by Bachelor's Degree
Demographics Similar to Luxembourgers by Bachelor's Degree
In terms of bachelor's degree, the demographic groups most similar to Luxembourgers are Assyrian/Chaldean/Syriac (39.8%, a difference of 0.080%), Pakistani (39.7%, a difference of 0.20%), Immigrants from Southern Europe (40.0%, a difference of 0.51%), Taiwanese (40.0%, a difference of 0.52%), and Icelander (39.5%, a difference of 0.57%).
| Demographics | Rating | Rank | Bachelor's Degree |
| Immigrants | Venezuela | 92.9 /100 | #128 | Exceptional 40.2% |
| Serbians | 92.4 /100 | #129 | Exceptional 40.1% |
| Sierra Leoneans | 92.2 /100 | #130 | Exceptional 40.1% |
| Italians | 91.9 /100 | #131 | Exceptional 40.1% |
| Taiwanese | 91.1 /100 | #132 | Exceptional 40.0% |
| Immigrants | Southern Europe | 91.1 /100 | #133 | Exceptional 40.0% |
| Assyrians/Chaldeans/Syriacs | 89.4 /100 | #134 | Excellent 39.8% |
| Luxembourgers | 89.1 /100 | #135 | Excellent 39.8% |
| Pakistanis | 88.2 /100 | #136 | Excellent 39.7% |
| Icelanders | 86.5 /100 | #137 | Excellent 39.5% |
| Europeans | 85.6 /100 | #138 | Excellent 39.5% |
| Immigrants | Sudan | 84.5 /100 | #139 | Excellent 39.4% |
| Immigrants | Armenia | 84.1 /100 | #140 | Excellent 39.4% |
| South American Indians | 83.6 /100 | #141 | Excellent 39.3% |
| Immigrants | North Macedonia | 81.6 /100 | #142 | Excellent 39.2% |
Demographics Similar to Comanche by Bachelor's Degree
In terms of bachelor's degree, the demographic groups most similar to Comanche are Central American (31.9%, a difference of 0.030%), Immigrants from Nicaragua (31.9%, a difference of 0.12%), American (31.9%, a difference of 0.12%), Potawatomi (31.9%, a difference of 0.14%), and Samoan (31.8%, a difference of 0.27%).
| Demographics | Rating | Rank | Bachelor's Degree |
| Bahamians | 0.3 /100 | #265 | Tragic 32.5% |
| Immigrants | Dominica | 0.3 /100 | #266 | Tragic 32.5% |
| Cubans | 0.3 /100 | #267 | Tragic 32.5% |
| Immigrants | Portugal | 0.2 /100 | #268 | Tragic 32.2% |
| Immigrants | Belize | 0.2 /100 | #269 | Tragic 32.1% |
| Immigrants | Nicaragua | 0.2 /100 | #270 | Tragic 31.9% |
| Central Americans | 0.2 /100 | #271 | Tragic 31.9% |
| Comanche | 0.2 /100 | #272 | Tragic 31.9% |
| Americans | 0.2 /100 | #273 | Tragic 31.9% |
| Potawatomi | 0.2 /100 | #274 | Tragic 31.9% |
| Samoans | 0.1 /100 | #275 | Tragic 31.8% |
| Salvadorans | 0.1 /100 | #276 | Tragic 31.8% |
| Dominicans | 0.1 /100 | #277 | Tragic 31.8% |
| Marshallese | 0.1 /100 | #278 | Tragic 31.7% |
| Hawaiians | 0.1 /100 | #279 | Tragic 31.6% |