Russian vs Immigrants from Latvia GED/Equivalency
COMPARE
Russian
Immigrants from Latvia
GED/Equivalency
GED/Equivalency Comparison
Russians
Immigrants from Latvia
88.6%
GED/EQUIVALENCY
99.8/ 100
METRIC RATING
23rd/ 347
METRIC RANK
88.1%
GED/EQUIVALENCY
99.5/ 100
METRIC RATING
47th/ 347
METRIC RANK
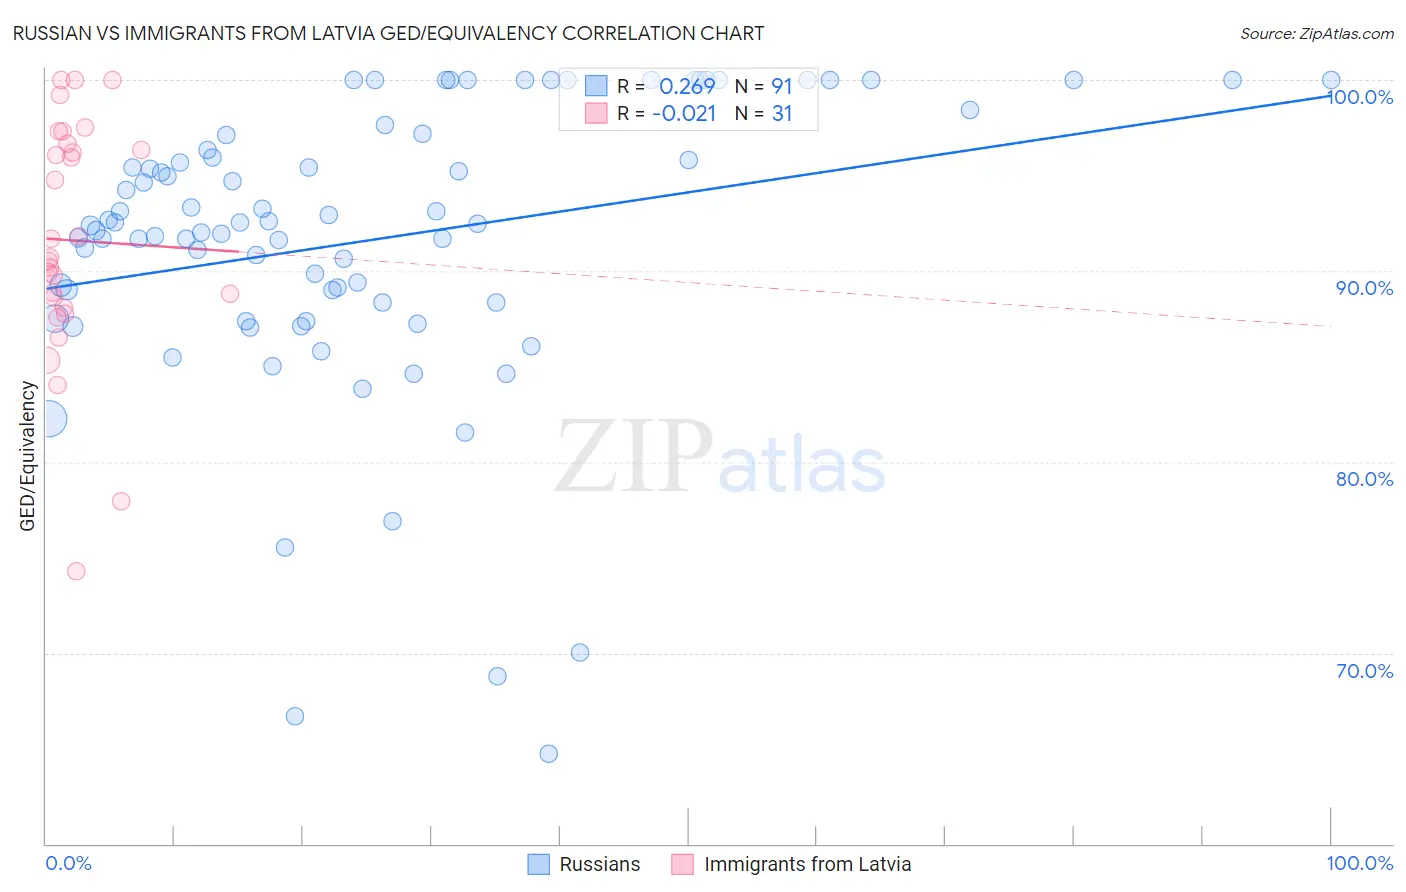
Russian vs Immigrants from Latvia GED/Equivalency Correlation Chart
The statistical analysis conducted on geographies consisting of 512,259,122 people shows a weak positive correlation between the proportion of Russians and percentage of population with at least ged/equivalency education in the United States with a correlation coefficient (R) of 0.269 and weighted average of 88.6%. Similarly, the statistical analysis conducted on geographies consisting of 113,735,345 people shows no correlation between the proportion of Immigrants from Latvia and percentage of population with at least ged/equivalency education in the United States with a correlation coefficient (R) of -0.021 and weighted average of 88.1%, a difference of 0.58%.
GED/Equivalency Correlation Summary
| Measurement | Russian | Immigrants from Latvia |
| Minimum | 64.7% | 74.3% |
| Maximum | 100.0% | 100.0% |
| Range | 35.3% | 25.7% |
| Mean | 91.6% | 91.6% |
| Median | 92.5% | 90.7% |
| Interquartile 25% (IQ1) | 88.3% | 88.1% |
| Interquartile 75% (IQ3) | 97.1% | 96.7% |
| Interquartile Range (IQR) | 8.8% | 8.5% |
| Standard Deviation (Sample) | 7.6% | 6.3% |
| Standard Deviation (Population) | 7.5% | 6.2% |
Similar Demographics by GED/Equivalency
Demographics Similar to Russians by GED/Equivalency
In terms of ged/equivalency, the demographic groups most similar to Russians are Slovak (88.6%, a difference of 0.0%), Estonian (88.6%, a difference of 0.0%), Immigrants from Australia (88.6%, a difference of 0.010%), Immigrants from Ireland (88.6%, a difference of 0.020%), and Luxembourger (88.6%, a difference of 0.030%).
| Demographics | Rating | Rank | GED/Equivalency |
| Immigrants | Taiwan | 99.9 /100 | #16 | Exceptional 88.8% |
| Croatians | 99.9 /100 | #17 | Exceptional 88.8% |
| Slovenes | 99.9 /100 | #18 | Exceptional 88.8% |
| Swedes | 99.9 /100 | #19 | Exceptional 88.8% |
| Maltese | 99.9 /100 | #20 | Exceptional 88.6% |
| Luxembourgers | 99.8 /100 | #21 | Exceptional 88.6% |
| Immigrants | Ireland | 99.8 /100 | #22 | Exceptional 88.6% |
| Russians | 99.8 /100 | #23 | Exceptional 88.6% |
| Slovaks | 99.8 /100 | #24 | Exceptional 88.6% |
| Estonians | 99.8 /100 | #25 | Exceptional 88.6% |
| Immigrants | Australia | 99.8 /100 | #26 | Exceptional 88.6% |
| Immigrants | Lithuania | 99.8 /100 | #27 | Exceptional 88.6% |
| Immigrants | Northern Europe | 99.8 /100 | #28 | Exceptional 88.5% |
| Poles | 99.8 /100 | #29 | Exceptional 88.5% |
| Turks | 99.8 /100 | #30 | Exceptional 88.5% |
Demographics Similar to Immigrants from Latvia by GED/Equivalency
In terms of ged/equivalency, the demographic groups most similar to Immigrants from Latvia are Immigrants from Switzerland (88.1%, a difference of 0.010%), Greek (88.1%, a difference of 0.010%), Australian (88.1%, a difference of 0.020%), Czech (88.1%, a difference of 0.030%), and Immigrants from Korea (88.1%, a difference of 0.030%).
| Demographics | Rating | Rank | GED/Equivalency |
| Italians | 99.6 /100 | #40 | Exceptional 88.2% |
| Finns | 99.6 /100 | #41 | Exceptional 88.2% |
| Cambodians | 99.6 /100 | #42 | Exceptional 88.2% |
| Immigrants | Scotland | 99.6 /100 | #43 | Exceptional 88.2% |
| Macedonians | 99.5 /100 | #44 | Exceptional 88.1% |
| Czechs | 99.5 /100 | #45 | Exceptional 88.1% |
| Immigrants | Switzerland | 99.5 /100 | #46 | Exceptional 88.1% |
| Immigrants | Latvia | 99.5 /100 | #47 | Exceptional 88.1% |
| Greeks | 99.5 /100 | #48 | Exceptional 88.1% |
| Australians | 99.5 /100 | #49 | Exceptional 88.1% |
| Immigrants | Korea | 99.5 /100 | #50 | Exceptional 88.1% |
| Immigrants | Netherlands | 99.4 /100 | #51 | Exceptional 88.0% |
| Zimbabweans | 99.4 /100 | #52 | Exceptional 88.0% |
| Immigrants | South Africa | 99.4 /100 | #53 | Exceptional 88.0% |
| Soviet Union | 99.4 /100 | #54 | Exceptional 88.0% |