Iroquois vs Immigrants from Latvia GED/Equivalency
COMPARE
Iroquois
Immigrants from Latvia
GED/Equivalency
GED/Equivalency Comparison
Iroquois
Immigrants from Latvia
84.6%
GED/EQUIVALENCY
7.5/ 100
METRIC RATING
222nd/ 347
METRIC RANK
88.1%
GED/EQUIVALENCY
99.5/ 100
METRIC RATING
47th/ 347
METRIC RANK
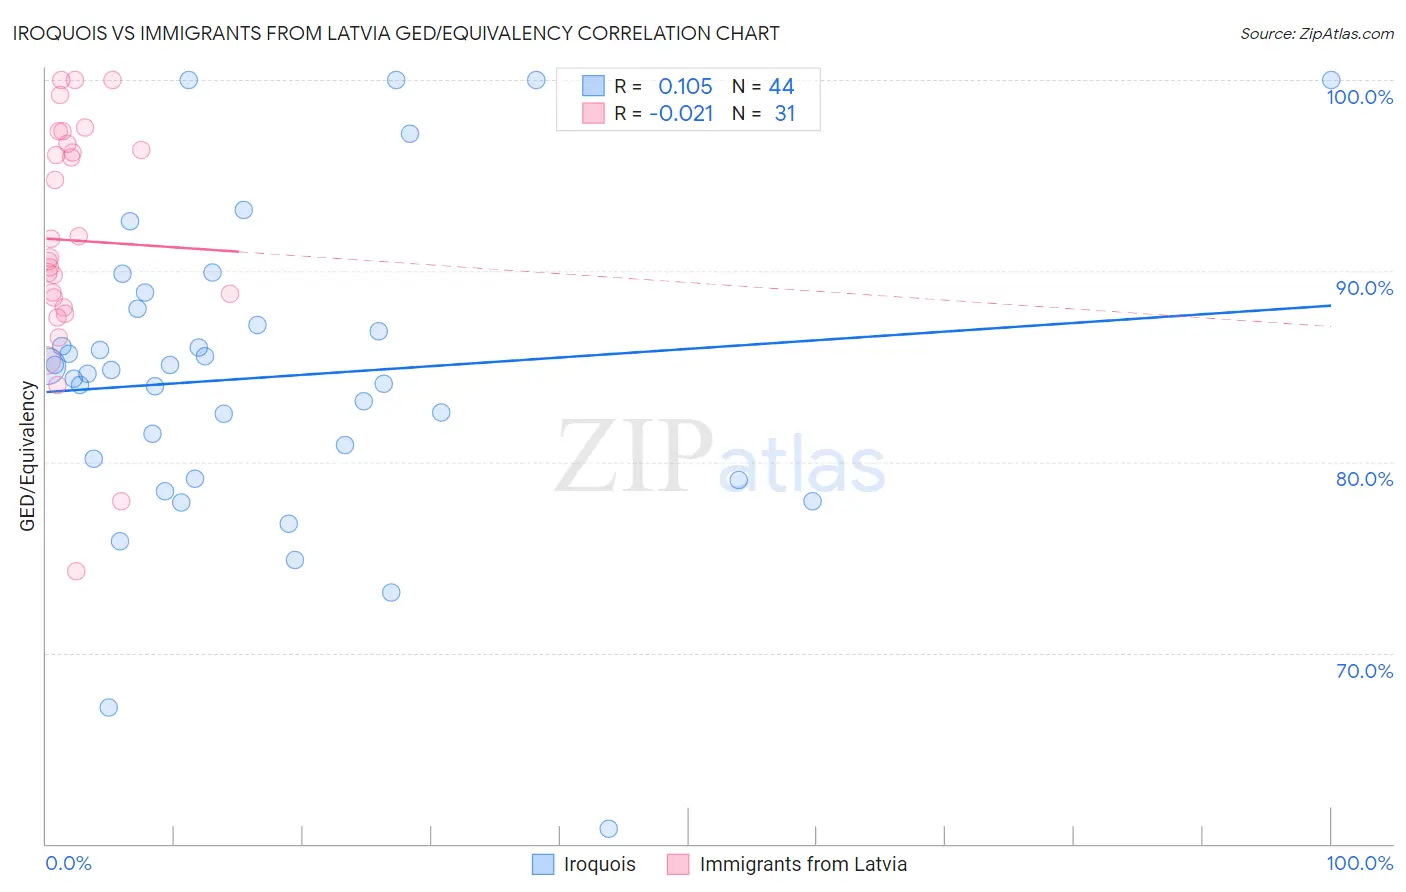
Iroquois vs Immigrants from Latvia GED/Equivalency Correlation Chart
The statistical analysis conducted on geographies consisting of 207,308,653 people shows a poor positive correlation between the proportion of Iroquois and percentage of population with at least ged/equivalency education in the United States with a correlation coefficient (R) of 0.105 and weighted average of 84.6%. Similarly, the statistical analysis conducted on geographies consisting of 113,735,345 people shows no correlation between the proportion of Immigrants from Latvia and percentage of population with at least ged/equivalency education in the United States with a correlation coefficient (R) of -0.021 and weighted average of 88.1%, a difference of 4.1%.
GED/Equivalency Correlation Summary
| Measurement | Iroquois | Immigrants from Latvia |
| Minimum | 60.8% | 74.3% |
| Maximum | 100.0% | 100.0% |
| Range | 39.2% | 25.7% |
| Mean | 84.4% | 91.6% |
| Median | 84.7% | 90.7% |
| Interquartile 25% (IQ1) | 79.6% | 88.1% |
| Interquartile 75% (IQ3) | 87.6% | 96.7% |
| Interquartile Range (IQR) | 8.0% | 8.5% |
| Standard Deviation (Sample) | 8.1% | 6.3% |
| Standard Deviation (Population) | 8.0% | 6.2% |
Similar Demographics by GED/Equivalency
Demographics Similar to Iroquois by GED/Equivalency
In terms of ged/equivalency, the demographic groups most similar to Iroquois are Immigrants from Uzbekistan (84.6%, a difference of 0.030%), Taiwanese (84.7%, a difference of 0.040%), Potawatomi (84.7%, a difference of 0.050%), American (84.7%, a difference of 0.050%), and Immigrants from Micronesia (84.7%, a difference of 0.080%).
| Demographics | Rating | Rank | GED/Equivalency |
| Peruvians | 9.2 /100 | #215 | Tragic 84.7% |
| Immigrants | Micronesia | 8.7 /100 | #216 | Tragic 84.7% |
| Nigerians | 8.6 /100 | #217 | Tragic 84.7% |
| Alaska Natives | 8.6 /100 | #218 | Tragic 84.7% |
| Potawatomi | 8.2 /100 | #219 | Tragic 84.7% |
| Americans | 8.2 /100 | #220 | Tragic 84.7% |
| Taiwanese | 8.1 /100 | #221 | Tragic 84.7% |
| Iroquois | 7.5 /100 | #222 | Tragic 84.6% |
| Immigrants | Uzbekistan | 7.1 /100 | #223 | Tragic 84.6% |
| French American Indians | 6.3 /100 | #224 | Tragic 84.6% |
| Immigrants | Thailand | 5.8 /100 | #225 | Tragic 84.5% |
| Immigrants | Zaire | 5.5 /100 | #226 | Tragic 84.5% |
| Immigrants | Costa Rica | 5.4 /100 | #227 | Tragic 84.5% |
| Immigrants | Liberia | 4.9 /100 | #228 | Tragic 84.4% |
| Immigrants | Uruguay | 4.6 /100 | #229 | Tragic 84.4% |
Demographics Similar to Immigrants from Latvia by GED/Equivalency
In terms of ged/equivalency, the demographic groups most similar to Immigrants from Latvia are Immigrants from Switzerland (88.1%, a difference of 0.010%), Greek (88.1%, a difference of 0.010%), Australian (88.1%, a difference of 0.020%), Czech (88.1%, a difference of 0.030%), and Immigrants from Korea (88.1%, a difference of 0.030%).
| Demographics | Rating | Rank | GED/Equivalency |
| Italians | 99.6 /100 | #40 | Exceptional 88.2% |
| Finns | 99.6 /100 | #41 | Exceptional 88.2% |
| Cambodians | 99.6 /100 | #42 | Exceptional 88.2% |
| Immigrants | Scotland | 99.6 /100 | #43 | Exceptional 88.2% |
| Macedonians | 99.5 /100 | #44 | Exceptional 88.1% |
| Czechs | 99.5 /100 | #45 | Exceptional 88.1% |
| Immigrants | Switzerland | 99.5 /100 | #46 | Exceptional 88.1% |
| Immigrants | Latvia | 99.5 /100 | #47 | Exceptional 88.1% |
| Greeks | 99.5 /100 | #48 | Exceptional 88.1% |
| Australians | 99.5 /100 | #49 | Exceptional 88.1% |
| Immigrants | Korea | 99.5 /100 | #50 | Exceptional 88.1% |
| Immigrants | Netherlands | 99.4 /100 | #51 | Exceptional 88.0% |
| Zimbabweans | 99.4 /100 | #52 | Exceptional 88.0% |
| Immigrants | South Africa | 99.4 /100 | #53 | Exceptional 88.0% |
| Soviet Union | 99.4 /100 | #54 | Exceptional 88.0% |