Russian vs Immigrants from Senegal GED/Equivalency
COMPARE
Russian
Immigrants from Senegal
GED/Equivalency
GED/Equivalency Comparison
Russians
Immigrants from Senegal
88.6%
GED/EQUIVALENCY
99.8/ 100
METRIC RATING
23rd/ 347
METRIC RANK
83.8%
GED/EQUIVALENCY
1.2/ 100
METRIC RATING
245th/ 347
METRIC RANK
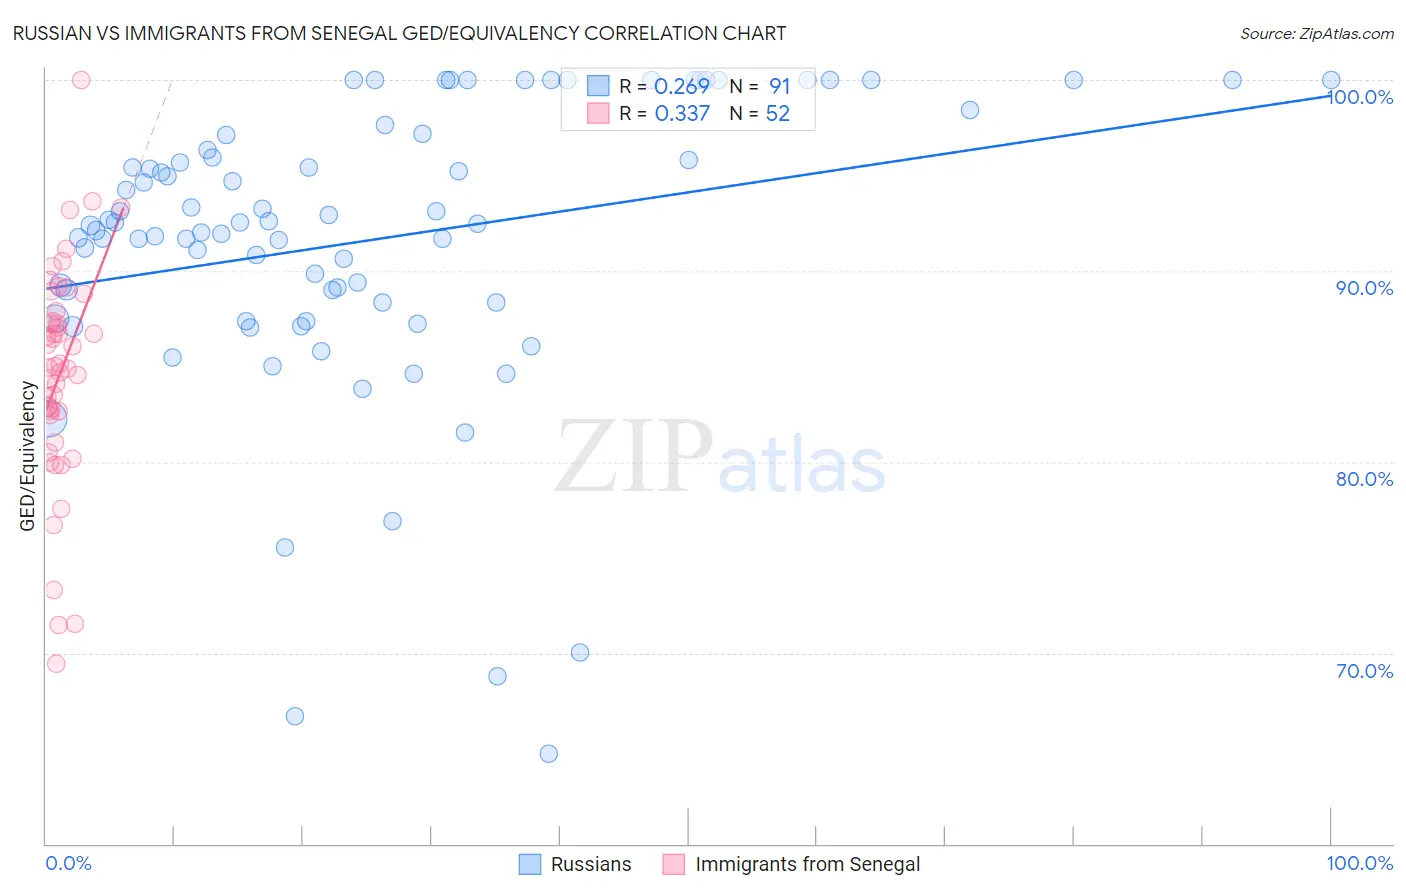
Russian vs Immigrants from Senegal GED/Equivalency Correlation Chart
The statistical analysis conducted on geographies consisting of 512,259,122 people shows a weak positive correlation between the proportion of Russians and percentage of population with at least ged/equivalency education in the United States with a correlation coefficient (R) of 0.269 and weighted average of 88.6%. Similarly, the statistical analysis conducted on geographies consisting of 90,130,297 people shows a mild positive correlation between the proportion of Immigrants from Senegal and percentage of population with at least ged/equivalency education in the United States with a correlation coefficient (R) of 0.337 and weighted average of 83.8%, a difference of 5.7%.
GED/Equivalency Correlation Summary
| Measurement | Russian | Immigrants from Senegal |
| Minimum | 64.7% | 69.5% |
| Maximum | 100.0% | 100.0% |
| Range | 35.3% | 30.5% |
| Mean | 91.6% | 84.7% |
| Median | 92.5% | 85.0% |
| Interquartile 25% (IQ1) | 88.3% | 82.5% |
| Interquartile 75% (IQ3) | 97.1% | 87.6% |
| Interquartile Range (IQR) | 8.8% | 5.1% |
| Standard Deviation (Sample) | 7.6% | 5.8% |
| Standard Deviation (Population) | 7.5% | 5.7% |
Similar Demographics by GED/Equivalency
Demographics Similar to Russians by GED/Equivalency
In terms of ged/equivalency, the demographic groups most similar to Russians are Slovak (88.6%, a difference of 0.0%), Estonian (88.6%, a difference of 0.0%), Immigrants from Australia (88.6%, a difference of 0.010%), Immigrants from Ireland (88.6%, a difference of 0.020%), and Luxembourger (88.6%, a difference of 0.030%).
| Demographics | Rating | Rank | GED/Equivalency |
| Immigrants | Taiwan | 99.9 /100 | #16 | Exceptional 88.8% |
| Croatians | 99.9 /100 | #17 | Exceptional 88.8% |
| Slovenes | 99.9 /100 | #18 | Exceptional 88.8% |
| Swedes | 99.9 /100 | #19 | Exceptional 88.8% |
| Maltese | 99.9 /100 | #20 | Exceptional 88.6% |
| Luxembourgers | 99.8 /100 | #21 | Exceptional 88.6% |
| Immigrants | Ireland | 99.8 /100 | #22 | Exceptional 88.6% |
| Russians | 99.8 /100 | #23 | Exceptional 88.6% |
| Slovaks | 99.8 /100 | #24 | Exceptional 88.6% |
| Estonians | 99.8 /100 | #25 | Exceptional 88.6% |
| Immigrants | Australia | 99.8 /100 | #26 | Exceptional 88.6% |
| Immigrants | Lithuania | 99.8 /100 | #27 | Exceptional 88.6% |
| Immigrants | Northern Europe | 99.8 /100 | #28 | Exceptional 88.5% |
| Poles | 99.8 /100 | #29 | Exceptional 88.5% |
| Turks | 99.8 /100 | #30 | Exceptional 88.5% |
Demographics Similar to Immigrants from Senegal by GED/Equivalency
In terms of ged/equivalency, the demographic groups most similar to Immigrants from Senegal are Chickasaw (83.8%, a difference of 0.020%), Immigrants from Ghana (83.9%, a difference of 0.030%), Cherokee (83.9%, a difference of 0.040%), Immigrants from Western Africa (83.8%, a difference of 0.050%), and Blackfeet (83.8%, a difference of 0.070%).
| Demographics | Rating | Rank | GED/Equivalency |
| Immigrants | Peru | 2.7 /100 | #238 | Tragic 84.2% |
| Immigrants | Bahamas | 2.6 /100 | #239 | Tragic 84.2% |
| Immigrants | South Eastern Asia | 2.5 /100 | #240 | Tragic 84.1% |
| Senegalese | 1.9 /100 | #241 | Tragic 84.0% |
| Sri Lankans | 1.9 /100 | #242 | Tragic 84.0% |
| Cherokee | 1.3 /100 | #243 | Tragic 83.9% |
| Immigrants | Ghana | 1.3 /100 | #244 | Tragic 83.9% |
| Immigrants | Senegal | 1.2 /100 | #245 | Tragic 83.8% |
| Chickasaw | 1.2 /100 | #246 | Tragic 83.8% |
| Immigrants | Western Africa | 1.1 /100 | #247 | Tragic 83.8% |
| Blackfeet | 1.1 /100 | #248 | Tragic 83.8% |
| Crow | 1.1 /100 | #249 | Tragic 83.8% |
| Shoshone | 1.0 /100 | #250 | Tragic 83.7% |
| Spanish Americans | 0.8 /100 | #251 | Tragic 83.6% |
| Bahamians | 0.8 /100 | #252 | Tragic 83.6% |