Immigrants from Canada vs Immigrants from Latvia GED/Equivalency
COMPARE
Immigrants from Canada
Immigrants from Latvia
GED/Equivalency
GED/Equivalency Comparison
Immigrants from Canada
Immigrants from Latvia
87.9%
GED/EQUIVALENCY
99.2/ 100
METRIC RATING
64th/ 347
METRIC RANK
88.1%
GED/EQUIVALENCY
99.5/ 100
METRIC RATING
47th/ 347
METRIC RANK
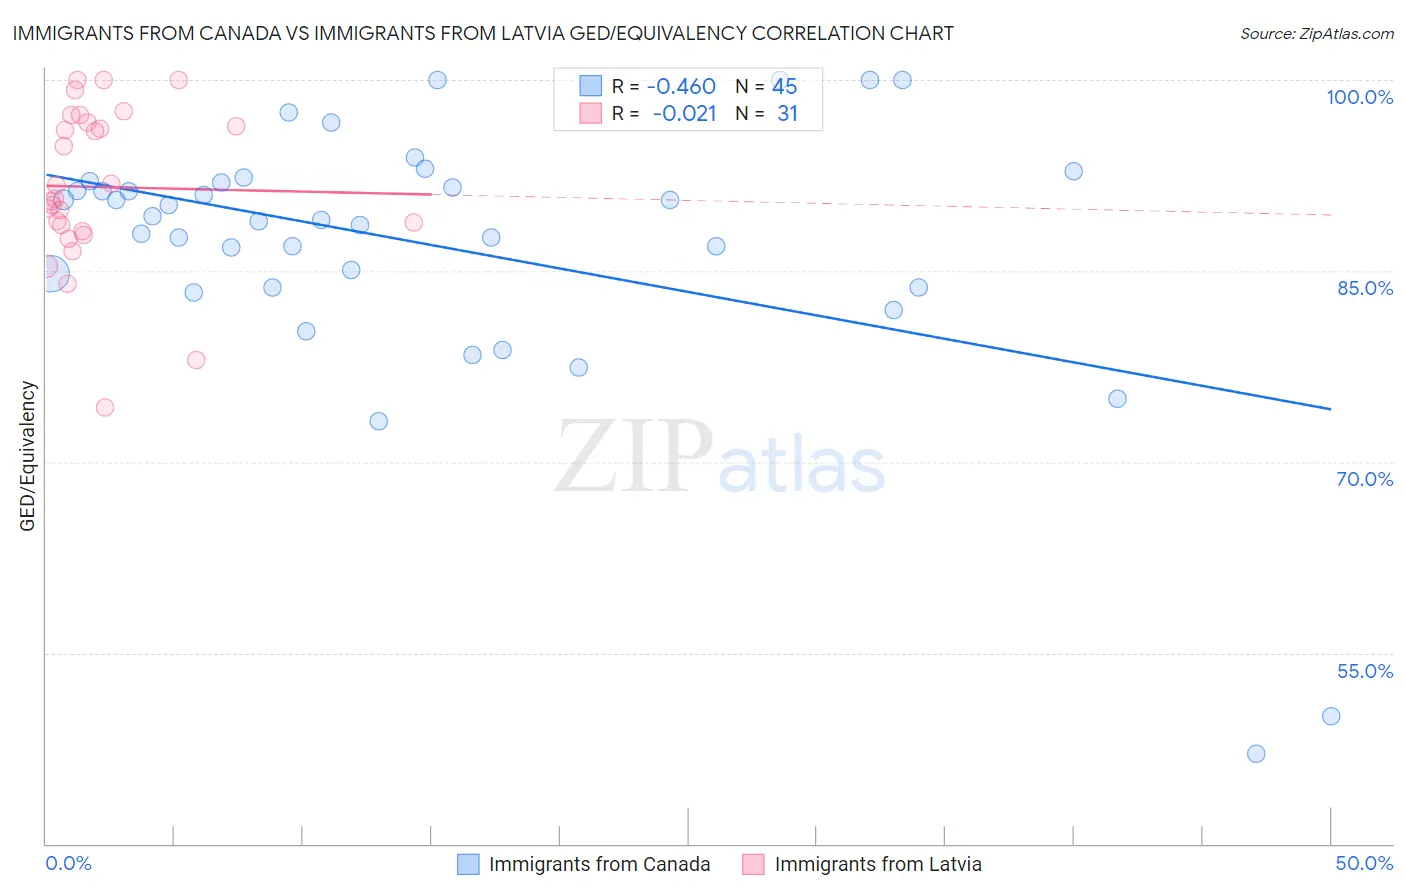
Immigrants from Canada vs Immigrants from Latvia GED/Equivalency Correlation Chart
The statistical analysis conducted on geographies consisting of 459,397,064 people shows a moderate negative correlation between the proportion of Immigrants from Canada and percentage of population with at least ged/equivalency education in the United States with a correlation coefficient (R) of -0.460 and weighted average of 87.9%. Similarly, the statistical analysis conducted on geographies consisting of 113,735,345 people shows no correlation between the proportion of Immigrants from Latvia and percentage of population with at least ged/equivalency education in the United States with a correlation coefficient (R) of -0.021 and weighted average of 88.1%, a difference of 0.24%.
GED/Equivalency Correlation Summary
| Measurement | Immigrants from Canada | Immigrants from Latvia |
| Minimum | 47.1% | 74.3% |
| Maximum | 100.0% | 100.0% |
| Range | 52.9% | 25.7% |
| Mean | 86.9% | 91.6% |
| Median | 89.0% | 90.7% |
| Interquartile 25% (IQ1) | 83.7% | 88.1% |
| Interquartile 75% (IQ3) | 92.0% | 96.7% |
| Interquartile Range (IQR) | 8.3% | 8.5% |
| Standard Deviation (Sample) | 10.5% | 6.3% |
| Standard Deviation (Population) | 10.4% | 6.2% |
Demographics Similar to Immigrants from Canada and Immigrants from Latvia by GED/Equivalency
In terms of ged/equivalency, the demographic groups most similar to Immigrants from Canada are Immigrants from North America (87.8%, a difference of 0.030%), Immigrants from Turkey (87.9%, a difference of 0.040%), German (87.9%, a difference of 0.050%), Scandinavian (87.9%, a difference of 0.070%), and European (87.9%, a difference of 0.070%). Similarly, the demographic groups most similar to Immigrants from Latvia are Immigrants from Switzerland (88.1%, a difference of 0.010%), Greek (88.1%, a difference of 0.010%), Australian (88.1%, a difference of 0.020%), Czech (88.1%, a difference of 0.030%), and Immigrants from Korea (88.1%, a difference of 0.030%).
| Demographics | Rating | Rank | GED/Equivalency |
| Czechs | 99.5 /100 | #45 | Exceptional 88.1% |
| Immigrants | Switzerland | 99.5 /100 | #46 | Exceptional 88.1% |
| Immigrants | Latvia | 99.5 /100 | #47 | Exceptional 88.1% |
| Greeks | 99.5 /100 | #48 | Exceptional 88.1% |
| Australians | 99.5 /100 | #49 | Exceptional 88.1% |
| Immigrants | Korea | 99.5 /100 | #50 | Exceptional 88.1% |
| Immigrants | Netherlands | 99.4 /100 | #51 | Exceptional 88.0% |
| Zimbabweans | 99.4 /100 | #52 | Exceptional 88.0% |
| Immigrants | South Africa | 99.4 /100 | #53 | Exceptional 88.0% |
| Soviet Union | 99.4 /100 | #54 | Exceptional 88.0% |
| New Zealanders | 99.4 /100 | #55 | Exceptional 88.0% |
| Immigrants | Denmark | 99.4 /100 | #56 | Exceptional 88.0% |
| Immigrants | Czechoslovakia | 99.3 /100 | #57 | Exceptional 87.9% |
| Northern Europeans | 99.3 /100 | #58 | Exceptional 87.9% |
| Serbians | 99.3 /100 | #59 | Exceptional 87.9% |
| Scandinavians | 99.3 /100 | #60 | Exceptional 87.9% |
| Europeans | 99.3 /100 | #61 | Exceptional 87.9% |
| Germans | 99.3 /100 | #62 | Exceptional 87.9% |
| Immigrants | Turkey | 99.2 /100 | #63 | Exceptional 87.9% |
| Immigrants | Canada | 99.2 /100 | #64 | Exceptional 87.9% |
| Immigrants | North America | 99.1 /100 | #65 | Exceptional 87.8% |